

AI infrastructure investment expands future capabilities: META resistance levels to watch

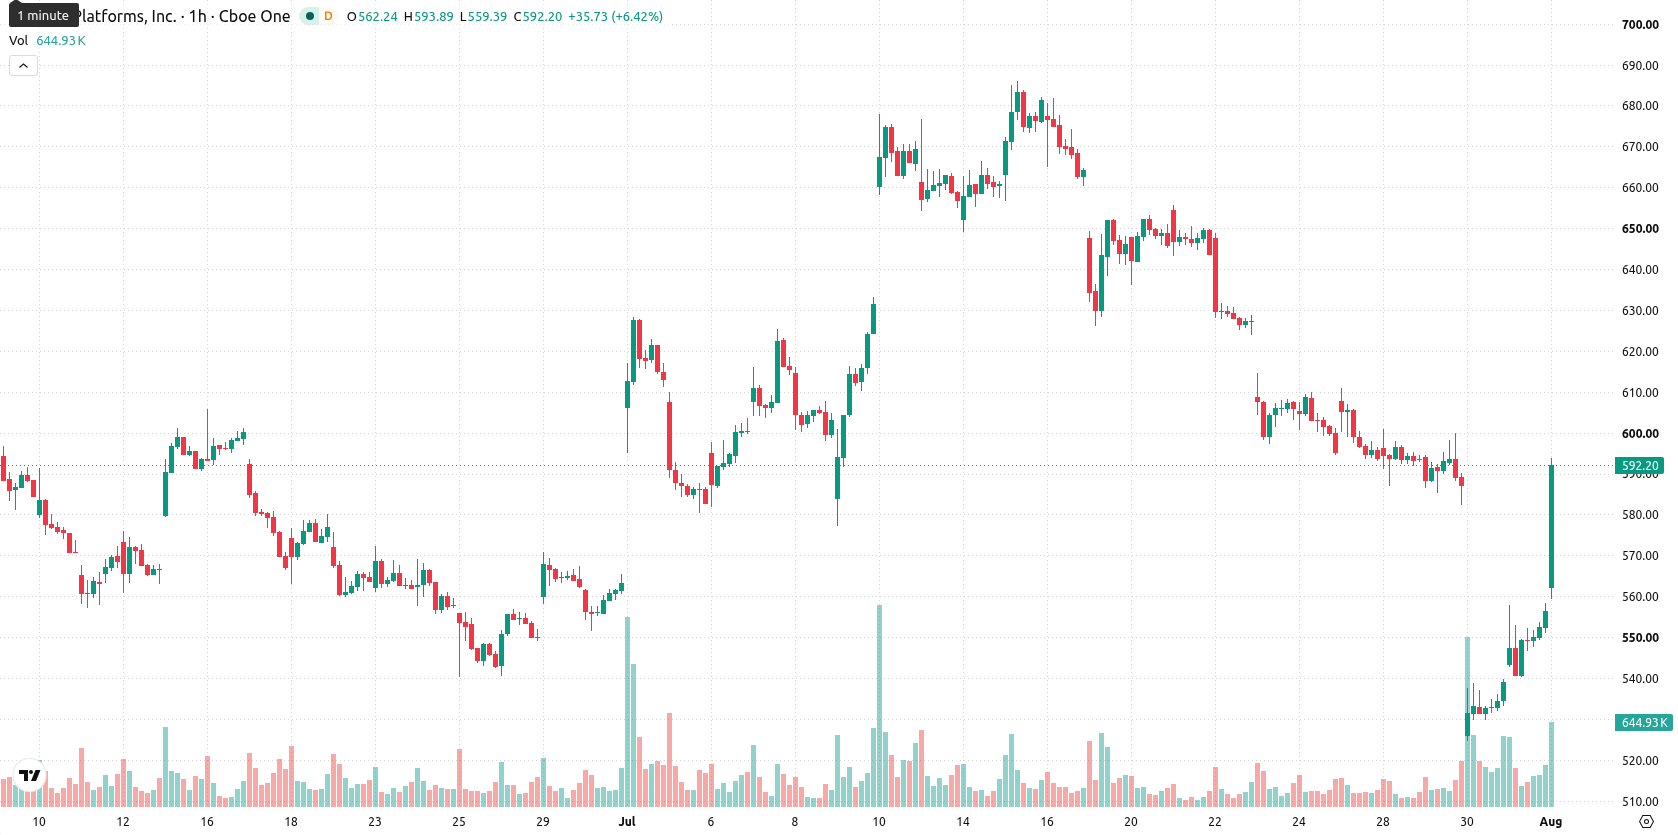
Meta (META) stock is trading at $592.32, posting a daily gain of 6.13%. The price currently stands above its key moving averages on the short and medium timeframes, with longer-term pressure still visible.
 643.77
647.20
Highlights
- Meta's Q2 2026 profits and free cash flow declined as capital was redeployed toward large-scale AI infrastructure investments.
- The company raised its 2026 capital expenditure floor to $130 billion, maintaining an aggressive budget for AI, signaling long-term strategic commitment.
- META/USD currently exhibits short- and medium-term upside bias, but price is likely to consolidate within a $558.1–$626.54 range due to mixed momentum signals.
Earnings-driven margin pressure as AI investments reshape outlook
Meta Platforms has reported its Q2 2026 earnings, displaying notable declines in profits and free cash flow as substantial funds were redirected toward AI investments, according to Gurufocus. This resource allocation highlights a strategic focus on long-term technology infrastructure, though it has placed pressure on near-term margins and available liquidity. In a related move, Meta has lifted the lower end of its 2026 capital expenditure guidance to $130 billion while maintaining an upper range of $145 billion, primarily for AI infrastructure, as reported by Foreignpolicyjournal. These developments underscore the company's commitment to advancing its AI capabilities, and they are reshaping investor expectations for both growth potential and near-term profitability.
Buyers dominate amid conflicting momentum and overbought signals
On the technical front, META is positioned above the MA-20 and MA-50 but remains below the MA-200 on the daily chart. The Ichimoku Kijun at $562.22 functions as the nearest support. Oscillator readings are mixed, with RSI at 63.77 issuing a Buy signal, MACD flashing a Strong Sell, and ADX staying in Buy mode. Bull/Bear Power, Stochastic RSI, and CCI show overbought conditions that highlight dominant buyer activity on an intraday basis, while the Awesome Oscillator is neutral. These divergences between momentum and oscillator indicators create a backdrop where both further extension and near-term retracement are possible.
Sideways price stabilization as downside odds edge higher
In the short term, META is likely to fluctuate within the $558.1 to $626.54 range based on typical volatility around the current level. Statistical probabilities show a slight tilt towards downside potential, with a 52% chance of a move lower and a 48% probability of an upward advance. The base case expects price stabilization in a sideways band, with a breakout above $626.54 defining a bullish scenario and a drop below $558 acting as confirmation of bearish momentum.
Earlier, analysts noted that Best Buy was adapting its business model with smaller store formats and AI-driven customer engagement to navigate a challenging retail environment. In Meta's case, the latest earnings reveal that aggressive AI investments are similarly reshaping both short-term profitability and long-term growth prospects, making volatility around key price levels—particularly $626.54 on the upside and $558 on the downside—a focal point for traders monitoring the next decisive move.






Latest META News





-
 Afghanistan
-
 Albania
-
 Algeria
-
 Angola
-
 Argentina
-
 Armenia
-
 Australia
-
 Austria
-
 Azerbaijan
-
 Bahamas
-
 Bahrain
-
 Bangladesh
-
 Belarus
-
 Belgium
-
 Bolivia
-
 Botswana
-
 Brazil
-
 Brunei
-
 Bulgaria
-
 Cambodia
-
 Cameroon
-
 Canada
-
 Chile
-
 China
-
 Colombia
-
 Congo
-
 Costa Rica
-
 Cote d'Ivoire
-
 Croatia
-
 Cuba
-
 Cyprus
-
 Czechia
-
 DR Congo
-
 Denmark
-
 Dominican Republic
-
 Ecuador
-
 Egypt
-
 El Salvador
-
 Estonia
-
 Eswatini
-
 Ethiopia
-
 Finland
-
 France
-
 Georgia
-
 Germany
-
 Ghana
-
 Greece
-
 Haiti
-
 Hong Kong
-
 Hungary
-
 India
-
 Indonesia
-
 Iran, Islamic republic
-
 Iraq
-
 Ireland
-
 Israel
-
 Italy
-
 Jamaica
-
 Japan
-
 Jordan
-
 Kazakhstan
-
 Kenya
-
 Korea
-
 Kuwait
-
 Kyrgyzstan
-
 Laos
-
 Latvia
-
 Lebanon
-
 Lesotho
-
 Libya
-
 Lithuania
-
 Luxembourg
-
 Madagascar
-
 Malaysia
-
 Malta
-
 Mauritius
-
 Mexico
-
 Moldova
-
 Mongolia
-
 Montenegro
-
 Morocco
-
 Mozambique
-
 Myanmar
-
 Namibia
-
 Nepal
-
 Netherlands
-
 New Zealand
-
 Nigeria
-
 North Macedonia
-
 Norway
-
 Oman
-
 Pakistan
-
 Palestine
-
 Panama
-
 Papua New Guinea
-
 Paraguay
-
 Peru
-
 Philippines
-
 Poland
-
 Portugal
-
 Puerto Rico
-
 Qatar
-
 Reunion
-
 Romania
-
 Rwanda
-
 Saudi Arabia
-
 Serbia
-
 Singapore
-
 Slovakia
-
 Slovenia
-
 Somalia
-
 South Africa
-
 Spain
-
 Sri Lanka
-
 Sweden
-
 Switzerland
-
 Syria
-
 Taiwan
-
 Tajikistan
-
 Tanzania
-
 Thailand
-
 Trinidad and Tobago
-
 Tunisia
-
 Turkey
-
 UAE
-
 Uganda
-
 Ukraine
-
 United Kingdom
-
United States
-
 Uruguay
-
 Uzbekistan
-
 Venezuela
-
 Vietnam
-
 Yemen
-
 Zambia
-
 Zimbabwe
- Forex
- Crypto












