

Mastercard shares weekly forecast: Upside limited as overbought technicals come into focus

Shares of Mastercard Inc (MA) are trading near $573 as the recovery setup holds its ground but shows signs of being stretched. The recent gains reflect steady momentum into August, but overbought technicals could limit near-term upside — keeping the focus on how the stretched rally resolves this week.
 622.13
622.13
622.13
Highlights
- Mastercard trades above key daily moving averages, confirming a bullish trend with price action near weekly highs.
- Momentum indicators signal overbought conditions and potential upside exhaustion, despite continued constructive structure.
- Base-case scenario calls for consolidation between $560.93 and $582.62, with sustained breakout above resistance enabling further gains toward $585.7.
Earnings beats and M&A activity underpin strong sentiment this week
Mastercard reported strong Q2 2026 financials, with both revenue and per-share profit surpassing analyst estimates according to Business Wire, Yahoo Finance, and MarketBeat. The company saw robust cross-border volume growth, announced an expanded virtual card platform, and completed its acquisition of BVNK on August 3, 2026 to bolster stablecoin payment infrastructure. Mastercard also continued shareholder returns with a $4.9 billion buyback and $771 million in dividends, while introducing new security and anti-fraud programs for enterprise clients ahead of the coming week.
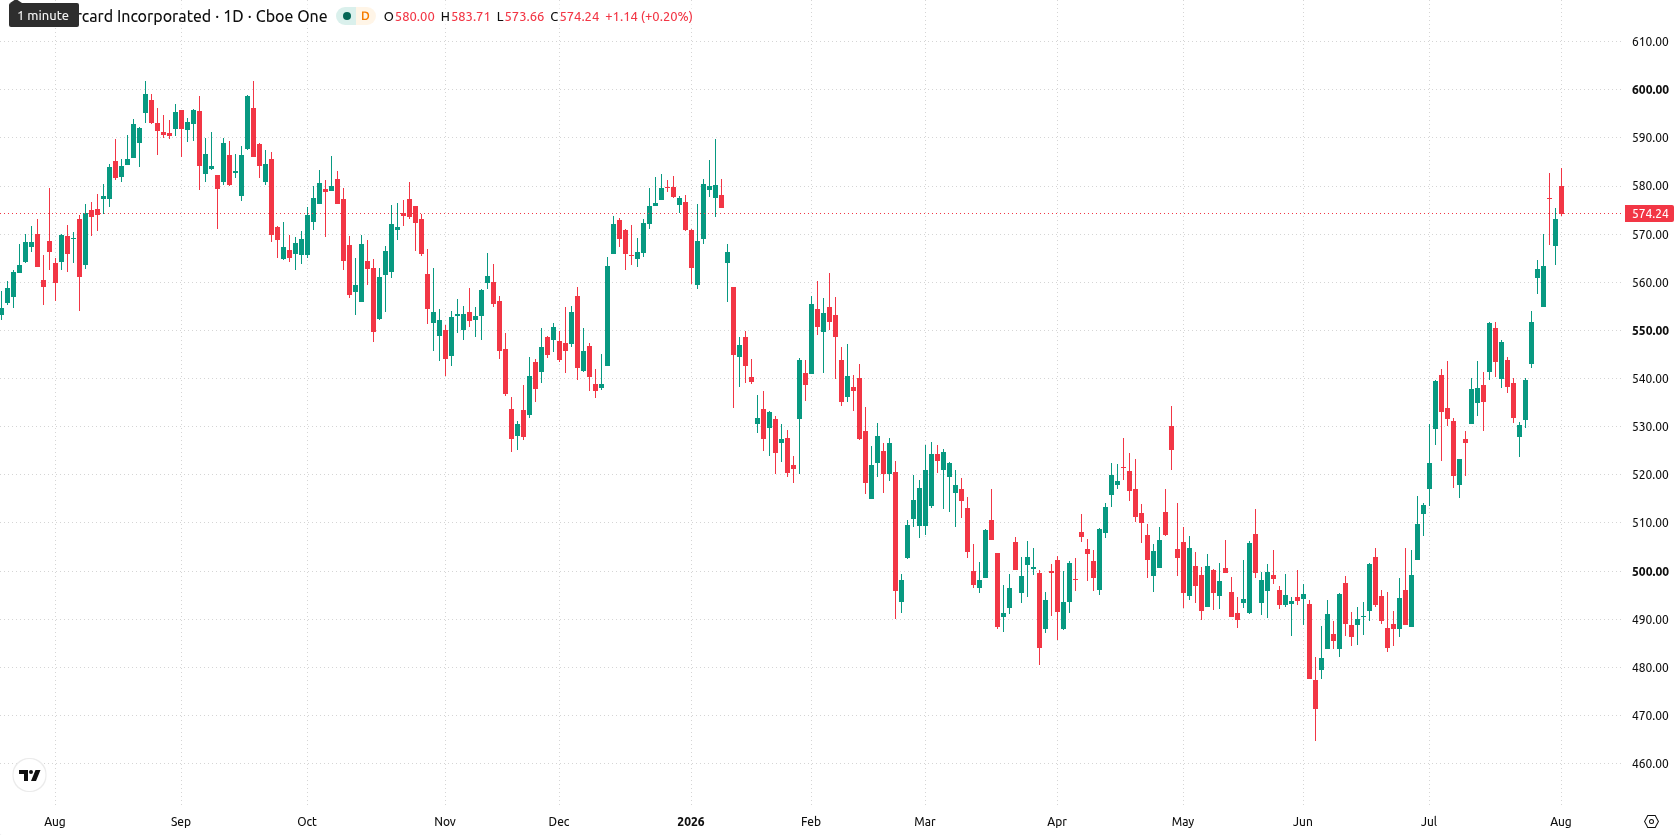
Momentum divergence emerges as technicals flag overbought risk this week
On the daily chart, the structure remains constructive, supported by price action in the upper part of this week’s range and a 4.99% bout of volatility. Momentum signals are firm but show developing divergence: MACD supports further upside with a value of 19.46, while Bull/Bear Power has entered an overbought zone. At the same time, both CCI and Stochastic RSI readings are in overbought territory, suggesting the move may be stretched. Immediate support is seen at $554.92 and resistance at $582.62, with the Ichimoku Kijun at $535.64 also offering a support reference.
Upside bias holds as range-bound action and breakout risks loom next week
For the next five trading days, the expected range is $560.93 to $585.7. There is a 72% probability of an increase and a 28% chance of a decline. Base case is range action between $560.93 and $582.62, with choppy momentum. A sustained push above $582.62 would open the door to further gains toward $585.7. A close below $554.92 would raise risk for a deeper pullback toward lower daily supports.
Earlier, analysts noted that Mastercard’s strong operating performance and robust shareholder returns were underpinning continued bullish momentum. With the rally now appearing stretched and key technicals signaling limited near-term upside, traders should watch for a decisive move above $582.62 to confirm breakout potential or a close below $554.92 to signal a deeper pullback risk.




Latest Mastercard News






-
 Afghanistan
-
 Albania
-
 Algeria
-
 Angola
-
 Argentina
-
 Armenia
-
 Australia
-
 Austria
-
 Azerbaijan
-
 Bahamas
-
 Bahrain
-
 Bangladesh
-
 Belarus
-
 Belgium
-
 Bolivia
-
 Botswana
-
 Brazil
-
 Brunei
-
 Bulgaria
-
 Cambodia
-
 Cameroon
-
 Canada
-
 Chile
Chile
-
 China
China
-
 Colombia
-
 Congo
Congo
-
 Costa Rica
-
 Cote d'Ivoire
-
 Croatia
-
 Cuba
Cuba
-
 Cyprus
-
 Czechia
-
 DR Congo
-
 Denmark
-
 Dominican Republic
-
 Ecuador
-
 Egypt
Egypt
-
 El Salvador
-
 Estonia
-
 Eswatini
-
 Ethiopia
-
 Finland
-
 France
-
 Georgia
-
 Germany
-
 Ghana
Ghana
-
 Greece
-
 Haiti
Haiti
-
 Hong Kong
-
 Hungary
-
 India
India
-
 Indonesia
-
 Iran, Islamic republic
-
 Iraq
Iraq
-
 Ireland
-
 Israel
-
 Italy
Italy
-
 Jamaica
-
 Japan
Japan
-
 Jordan
-
 Kazakhstan
-
 Kenya
Kenya
-
 Korea
Korea
-
 Kuwait
-
 Kyrgyzstan
-
 Laos
Laos
-
 Latvia
-
 Lebanon
-
 Lesotho
-
 Libya
Libya
-
 Lithuania
-
 Luxembourg
-
 Madagascar
-
 Malaysia
-
 Malta
Malta
-
 Mauritius
-
 Mexico
-
 Moldova
-
 Mongolia
-
 Montenegro
-
 Morocco
-
 Mozambique
-
 Myanmar
-
 Namibia
-
 Nepal
Nepal
-
 Netherlands
-
 New Zealand
-
 Nigeria
-
 North Macedonia
-
 Norway
-
 Oman
Oman
-
 Pakistan
-
 Palestine
-
 Panama
-
 Papua New Guinea
-
 Paraguay
-
 Peru
Peru
-
 Philippines
-
 Poland
-
 Portugal
-
 Puerto Rico
-
 Qatar
Qatar
-
 Reunion
-
 Romania
-
 Rwanda
-
 Saudi Arabia
-
 Serbia
-
 Singapore
-
 Slovakia
-
 Slovenia
-
 Somalia
-
 South Africa
-
 Spain
Spain
-
 Sri Lanka
-
 Sweden
-
 Switzerland
-
 Syria
Syria
-
 Taiwan
-
 Tajikistan
-
 Tanzania
-
 Thailand
-
 Trinidad and Tobago
-
 Tunisia
-
 Turkey
-
 UAE
UAE
-
 Uganda
-
 Ukraine
-
 United Kingdom
-
United States
-
 Uruguay
-
 Uzbekistan
-
 Venezuela
-
 Vietnam
-
 Yemen
Yemen
-
 Zambia
-
 Zimbabwe
- Forex
- Crypto












