

Johnson & Johnson stock holds just above $250.92 support as conflicting signals persist: weekly analysis

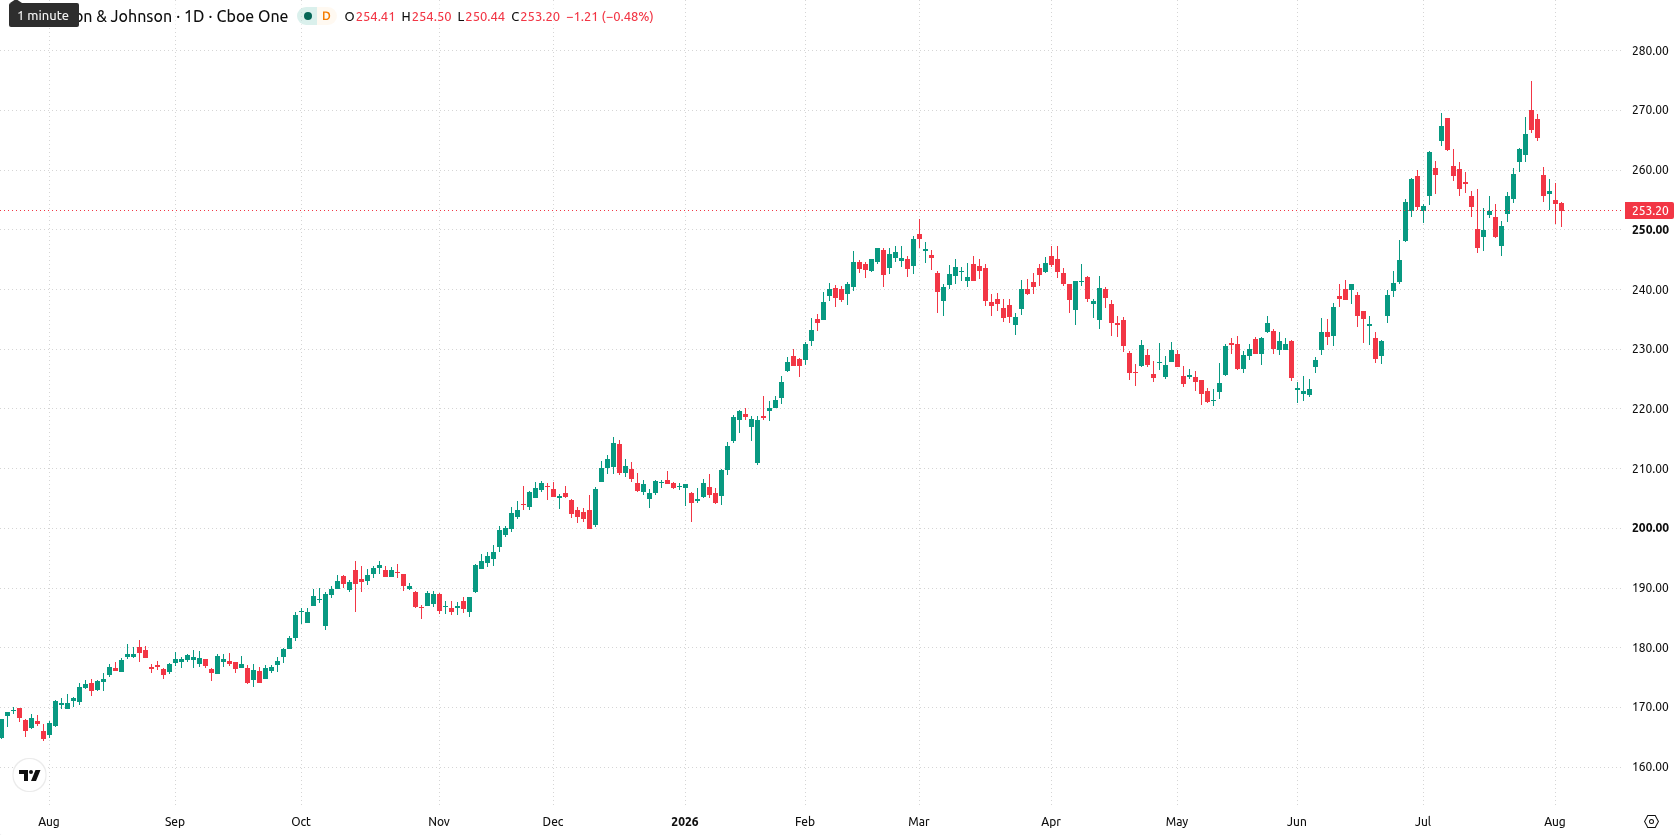
Shares of Johnson & Johnson (JNJ) are trading near $253 after slipping roughly 1.5% over the past week, as mixed signals on the daily chart highlight uncertainty about the next move. Declining momentum has stretched the decline into oversold territory, with technical indicators offering a conflicting view that leaves direction for the coming week unclear.
 257.46
264.13
257.46
264.13
Highlights
- Johnson & Johnson stock declined 1.5% over the past week, closing at $252.62 and approaching key support.
- The long-term chart remains bullish but near-term momentum is mixed, with conflicting buy and sell signals from technical indicators.
- Shares are expected to trade in the $244.38 to $260.88 range over the next five days, with 62% probability of an upward move.
Biotech deals and oncology advances weigh on outlook and support sentiment
JNJ finalized its $1 billion acquisition of Firefly Bio, according to an official press release on July 29, 2026, supporting its push into advanced biotech markets. The company also initiated a strategic partnership with Sail Biomedicines, expanding its focus on innovative CAR-T therapies for autoimmune and oncology uses. At the same time, JNJ lowered its 2026 adjusted EPS outlook due to the financial impact of these deals, while maintaining commitment to its $100 billion annual revenue target and increasing its dividend for the 64th consecutive year. The backdrop includes a Priority Review designation from the FDA to RYBREVANT FASPRO, further building on JNJ’s oncology pipeline.
Conflicting momentum and oversold signals shape technical stance this week
On the daily chart, momentum is mixed after a volatile 7.34% week, with price action at the very bottom of the recent range near support. Stochastic RSI shows an oversold reading at 8.71, while the MACD provides a strong buy forecast, but the HMA leans to the sell side, highlighting the contradiction in signals. Nearest support is at $250.92, while resistance aligns with the 20-day average at $257.56 and the Ichimoku Kijun at $260.2. This suggests the daily structure is waiting for a clearer confirmation, with an emerging move lower that is not yet confirmed.
Consolidation likely as breakout risks hinge on key support or resistance
Over the next five trading days, Johnson & Johnson shares are expected to trade between $244.38 and $260.88. The probability of an increase stands at 62%, with a 38% chance of a decrease. Base case: the stock consolidates between the $250.92 support and $257.56 resistance. A sustained break above $257.56 would open a push towards $260.88 resistance, while a drop below $250.92 would risk further downside toward the $244.38 area.
Previously it was reported that Johnson & Johnson faced near-term caution following the Firefly Bio acquisition and a downward revision to its profit outlook. The latest technical setup introduces a more balanced risk profile, with the current consolidation zone between $250.92 and $257.56 acting as a pivotal area for traders to monitor in the days ahead.





Latest Johnson & Johnson News






-
 Afghanistan
-
 Albania
-
 Algeria
-
 Angola
-
 Argentina
-
 Armenia
-
 Australia
-
 Austria
-
 Azerbaijan
-
 Bahamas
-
 Bahrain
-
 Bangladesh
-
 Belarus
-
 Belgium
-
 Bolivia
-
 Botswana
-
 Brazil
-
 Brunei
-
 Bulgaria
-
 Cambodia
-
 Cameroon
-
 Canada
-
 Chile
Chile
-
 China
China
-
 Colombia
-
 Congo
Congo
-
 Costa Rica
-
 Cote d'Ivoire
-
 Croatia
-
 Cuba
Cuba
-
 Cyprus
-
 Czechia
-
 DR Congo
-
 Denmark
-
 Dominican Republic
-
 Ecuador
-
 Egypt
Egypt
-
 El Salvador
-
 Estonia
-
 Eswatini
-
 Ethiopia
-
 Finland
-
 France
-
 Georgia
-
 Germany
-
 Ghana
Ghana
-
 Greece
-
 Haiti
Haiti
-
 Hong Kong
-
 Hungary
-
 India
India
-
 Indonesia
-
 Iran, Islamic republic
-
 Iraq
Iraq
-
 Ireland
-
 Israel
-
 Italy
Italy
-
 Jamaica
-
 Japan
Japan
-
 Jordan
-
 Kazakhstan
-
 Kenya
Kenya
-
 Korea
Korea
-
 Kuwait
-
 Kyrgyzstan
-
 Laos
Laos
-
 Latvia
-
 Lebanon
-
 Lesotho
-
 Libya
Libya
-
 Lithuania
-
 Luxembourg
-
 Madagascar
-
 Malaysia
-
 Malta
Malta
-
 Mauritius
-
 Mexico
-
 Moldova
-
 Mongolia
-
 Montenegro
-
 Morocco
-
 Mozambique
-
 Myanmar
-
 Namibia
-
 Nepal
Nepal
-
 Netherlands
-
 New Zealand
-
 Nigeria
-
 North Macedonia
-
 Norway
-
 Oman
Oman
-
 Pakistan
-
 Palestine
-
 Panama
-
 Papua New Guinea
-
 Paraguay
-
 Peru
Peru
-
 Philippines
-
 Poland
-
 Portugal
-
 Puerto Rico
-
 Qatar
Qatar
-
 Reunion
-
 Romania
-
 Rwanda
-
 Saudi Arabia
-
 Serbia
-
 Singapore
-
 Slovakia
-
 Slovenia
-
 Somalia
-
 South Africa
-
 Spain
Spain
-
 Sri Lanka
-
 Sweden
-
 Switzerland
-
 Syria
Syria
-
 Taiwan
-
 Tajikistan
-
 Tanzania
-
 Thailand
-
 Trinidad and Tobago
-
 Tunisia
-
 Turkey
-
 UAE
UAE
-
 Uganda
-
 Ukraine
-
 United Kingdom
-
United States
-
 Uruguay
-
 Uzbekistan
-
 Venezuela
-
 Vietnam
-
 Yemen
Yemen
-
 Zambia
-
 Zimbabwe
- Forex
- Crypto












