

Can Home Depot stock extend gains as upward trend continues?

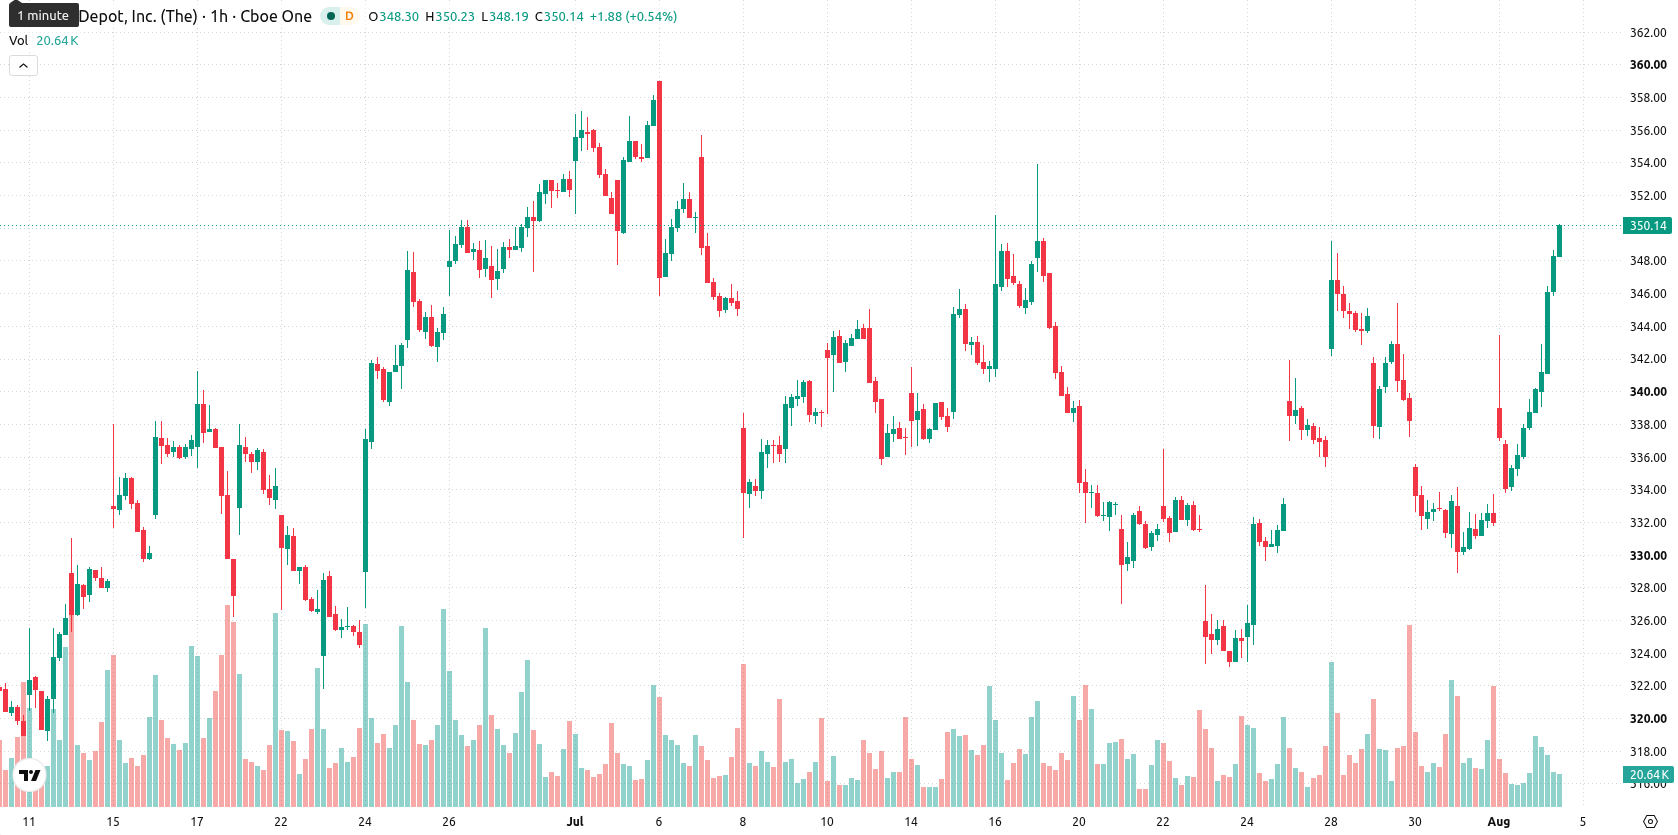
Home Depot (HD) stock is trading at $350.15, up 3.08% on the day. The price sits above its key moving averages, reflecting strong momentum in both the short and medium terms.
 349.34
356.88
Highlights
- Sapient Capital LLC reduced its Home Depot stock position by 11.5% in the first quarter, selling 8,432 shares.
- Despite this institutional trimming, overall market demand for shares of Home Depot remains strong and liquidity stable.
- Home Depot stock trades with robust upward momentum, projected to consolidate in a $342.85 to $359.43 range as overbought technical signals warn of possible short-term exhaustion.
Institutional trimming reshapes sentiment amid resilient overall demand
Sapient Capital LLC trimmed its position in Home Depot by 11.5% during the first quarter, selling 8,432 shares and retaining 65,126, according to Themarketsdaily. Such a significant adjustment by an institutional investor may influence market sentiment as large holders rebalance their portfolios, potentially impacting both liquidity and expectations for future performance. While this move reflects a shift in individual institutional exposure, broader demand for HD appears resilient in the current market context.
Bullish momentum persists as overbought signals emerge
On the hourly chart, HD trades above both the MA-20 at $336.46 and the MA-50 at $337.56, while the daily chart places the price above the MA-200 at $348.88. Support is established at the Ichimoku Kijun level of $339.29. Momentum indicators remain bullish, with MACD, ADX, and Awesome Oscillator all confirming positive trend conditions. However, intraday RSI is elevated at 75.31, pointing to overbought territory, and both Stochastic RSI and CCI also signal overextension. Bull/Bear Power shows bulls maintaining control, though these oscillator readings warn of possible short-term exhaustion.
Consolidation likely as volatility bands frame outlook
In the short term, HD is expected to trade within a $342.85 to $359.43 range, reflecting typical volatility bands at current levels. The probability of continued gains is high at 79%, while the risk of a near-term pullback sits at 21%. The primary scenario anticipates horizontal consolidation; a decisive move above resistance could lead to fresh highs, whereas a drop back below immediate support may trigger a sharper reversal.
Earlier, analysts noted that Home Depot shares were consolidating with strong short-term momentum, awaiting a potential breakout above key resistance. The latest trading action, coupled with institutional portfolio adjustments, reinforces the scenario of continued consolidation with a heightened focus on the evolving $359.43 resistance as a pivotal level for near-term direction.









-
 Afghanistan
-
 Albania
-
 Algeria
-
 Angola
-
 Argentina
-
 Armenia
-
 Australia
-
 Austria
-
 Azerbaijan
-
 Bahamas
-
 Bahrain
-
 Bangladesh
-
 Belarus
-
 Belgium
-
 Bolivia
-
 Botswana
-
 Brazil
-
 Brunei
-
 Bulgaria
-
 Cambodia
-
 Cameroon
-
 Canada
-
 Chile
-
 China
-
 Colombia
-
 Congo
-
 Costa Rica
-
 Cote d'Ivoire
-
 Croatia
-
 Cuba
-
 Cyprus
-
 Czechia
-
 DR Congo
-
 Denmark
-
 Dominican Republic
-
 Ecuador
-
 Egypt
-
 El Salvador
-
 Estonia
-
 Eswatini
-
 Ethiopia
-
 Finland
-
 France
-
 Georgia
-
 Germany
-
 Ghana
-
 Greece
-
 Haiti
-
 Hong Kong
-
 Hungary
-
 India
-
 Indonesia
-
 Iran, Islamic republic
-
 Iraq
-
 Ireland
-
 Israel
-
 Italy
-
 Jamaica
-
 Japan
-
 Jordan
-
 Kazakhstan
-
 Kenya
-
 Korea
-
 Kuwait
-
 Kyrgyzstan
-
 Laos
-
 Latvia
-
 Lebanon
-
 Lesotho
-
 Libya
-
 Lithuania
-
 Luxembourg
-
 Madagascar
-
 Malaysia
-
 Malta
-
 Mauritius
-
 Mexico
-
 Moldova
-
 Mongolia
-
 Montenegro
-
 Morocco
-
 Mozambique
-
 Myanmar
-
 Namibia
-
 Nepal
-
 Netherlands
-
 New Zealand
-
 Nigeria
-
 North Macedonia
-
 Norway
-
 Oman
-
 Pakistan
-
 Palestine
-
 Panama
-
 Papua New Guinea
-
 Paraguay
-
 Peru
-
 Philippines
-
 Poland
-
 Portugal
-
 Puerto Rico
-
 Qatar
-
 Reunion
-
 Romania
-
 Rwanda
-
 Saudi Arabia
-
 Serbia
-
 Singapore
-
 Slovakia
-
 Slovenia
-
 Somalia
-
 South Africa
-
 Spain
-
 Sri Lanka
-
 Sweden
-
 Switzerland
-
 Syria
-
 Taiwan
-
 Tajikistan
-
 Tanzania
-
 Thailand
-
 Trinidad and Tobago
-
 Tunisia
-
 Turkey
-
 UAE
-
 Uganda
-
 Ukraine
-
 United Kingdom
-
United States
-
 Uruguay
-
 Uzbekistan
-
 Venezuela
-
 Vietnam
-
 Yemen
-
 Zambia
-
 Zimbabwe
- Forex
- Crypto












