


Cigna Corp (CI) dropped 2.98% as sustained selling pressure and oversold momentum signals drove a sharp move lower. The downside is supported by the stock trading below all major moving averages and sellers dominating across short- and long-term trends.
 303.08
300.11
303.08
300.11
Highlights
- Cigna stock trades below short-, medium-, and long-term moving averages, signaling sustained seller pressure across timeframes.
- Momentum indicators are mixed with a neutral trend bias, while oversold signals and weak intraday momentum favor sellers.
- Next five days, price is expected to move within $260.5 to $286.8, with 58% probability of a further decline and key support at $272.26.
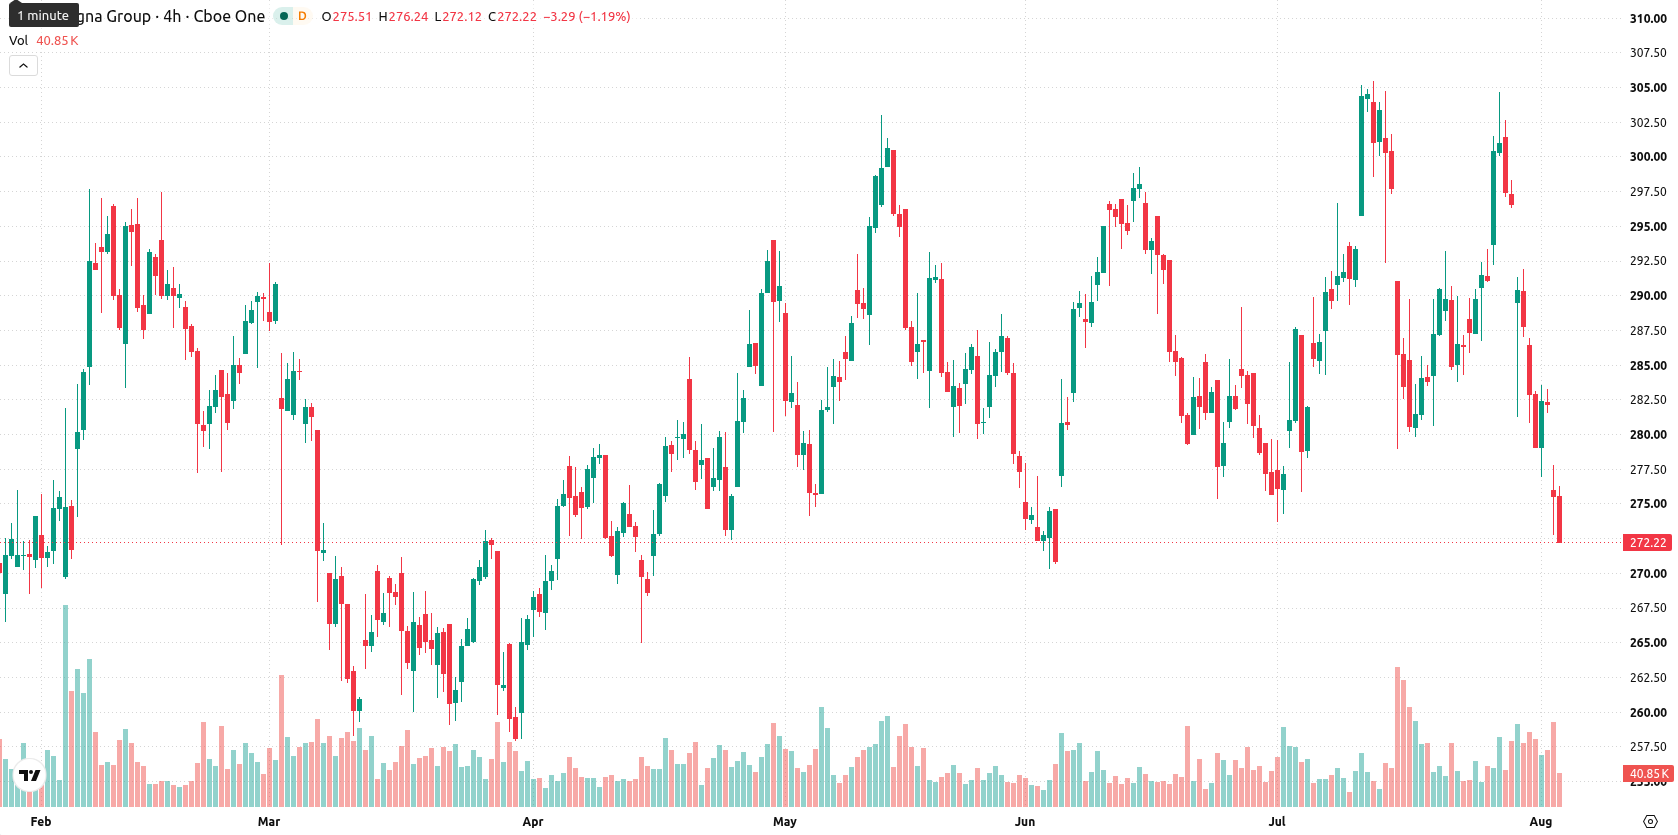
Mixed momentum as key averages breached and oversold signals strengthen
Cigna is trading below the 20-day, 50-day, and 200-day moving averages at $290.25, $286.46, and $279.83 respectively, indicating pressure from sellers across short-, medium-, and long-term trends. The nearest ceiling is at $276.33, with a floor at $272.26. MA-50 remains above MA-200, which supports a bullish longer-term trend structure. Momentum signals are mixed: MACD and Average Directional Index (ADX) are both neutral, suggesting an absence of a decisive trend. Relative Strength Index (RSI) is at 45.43 with a “Sell” outlook, and both Stochastic RSI (14.15) and Commodity Channel Index (CCI) (-113.96) point to oversold conditions. Bull/Bear Power (BBP) stands at -4.51, confirming sellers dominate intraday momentum and forecasting an oversold market. After a downside gap of about $8.06 (2.86%), price is mid-range for the session, with volatility at 1.49%. Intraday tone is weak, with pressure following the open in line with momentum signals.
Earlier, analysts noted that short-term volatility and mixed momentum signals were setting the tone for several major U.S. stocks. The current technical setup for Cigna adds to this picture by highlighting oversold conditions and dominance by sellers, making a sustained break above the $276.33 resistance a decisive level to watch for any potential recovery.





Latest Cigna News






-
 Afghanistan
-
 Albania
-
 Algeria
-
 Angola
-
 Argentina
-
 Armenia
-
 Australia
-
 Austria
-
 Azerbaijan
-
 Bahamas
-
 Bahrain
-
 Bangladesh
-
 Belarus
-
 Belgium
-
 Bolivia
-
 Botswana
-
 Brazil
-
 Brunei
-
 Bulgaria
-
 Cambodia
-
 Cameroon
-
 Canada
-
 Chile
Chile
-
 China
China
-
 Colombia
-
 Congo
Congo
-
 Costa Rica
-
 Cote d'Ivoire
-
 Croatia
-
 Cuba
Cuba
-
 Cyprus
-
 Czechia
-
 DR Congo
-
 Denmark
-
 Dominican Republic
-
 Ecuador
-
 Egypt
Egypt
-
 El Salvador
-
 Estonia
-
 Eswatini
-
 Ethiopia
-
 Finland
-
 France
-
 Georgia
-
 Germany
-
 Ghana
Ghana
-
 Greece
-
 Haiti
Haiti
-
 Hong Kong
-
 Hungary
-
 India
India
-
 Indonesia
-
 Iran, Islamic republic
-
 Iraq
Iraq
-
 Ireland
-
 Israel
-
 Italy
Italy
-
 Jamaica
-
 Japan
Japan
-
 Jordan
-
 Kazakhstan
-
 Kenya
Kenya
-
 Korea
Korea
-
 Kuwait
-
 Kyrgyzstan
-
 Laos
Laos
-
 Latvia
-
 Lebanon
-
 Lesotho
-
 Libya
Libya
-
 Lithuania
-
 Luxembourg
-
 Madagascar
-
 Malaysia
-
 Malta
Malta
-
 Mauritius
-
 Mexico
-
 Moldova
-
 Mongolia
-
 Montenegro
-
 Morocco
-
 Mozambique
-
 Myanmar
-
 Namibia
-
 Nepal
Nepal
-
 Netherlands
-
 New Zealand
-
 Nigeria
-
 North Macedonia
-
 Norway
-
 Oman
Oman
-
 Pakistan
-
 Palestine
-
 Panama
-
 Papua New Guinea
-
 Paraguay
-
 Peru
Peru
-
 Philippines
-
 Poland
-
 Portugal
-
 Puerto Rico
-
 Qatar
Qatar
-
 Reunion
-
 Romania
-
 Rwanda
-
 Saudi Arabia
-
 Serbia
-
 Singapore
-
 Slovakia
-
 Slovenia
-
 Somalia
-
 South Africa
-
 Spain
Spain
-
 Sri Lanka
-
 Sweden
-
 Switzerland
-
 Syria
Syria
-
 Taiwan
-
 Tajikistan
-
 Tanzania
-
 Thailand
-
 Trinidad and Tobago
-
 Tunisia
-
 Turkey
-
 UAE
UAE
-
 Uganda
-
 Ukraine
-
 United Kingdom
-
United States
-
 Uruguay
-
 Uzbekistan
-
 Venezuela
-
 Vietnam
-
 Yemen
Yemen
-
 Zambia
-
 Zimbabwe
- Forex
- Crypto












