

What's behind Cigna's latest stock pullback?

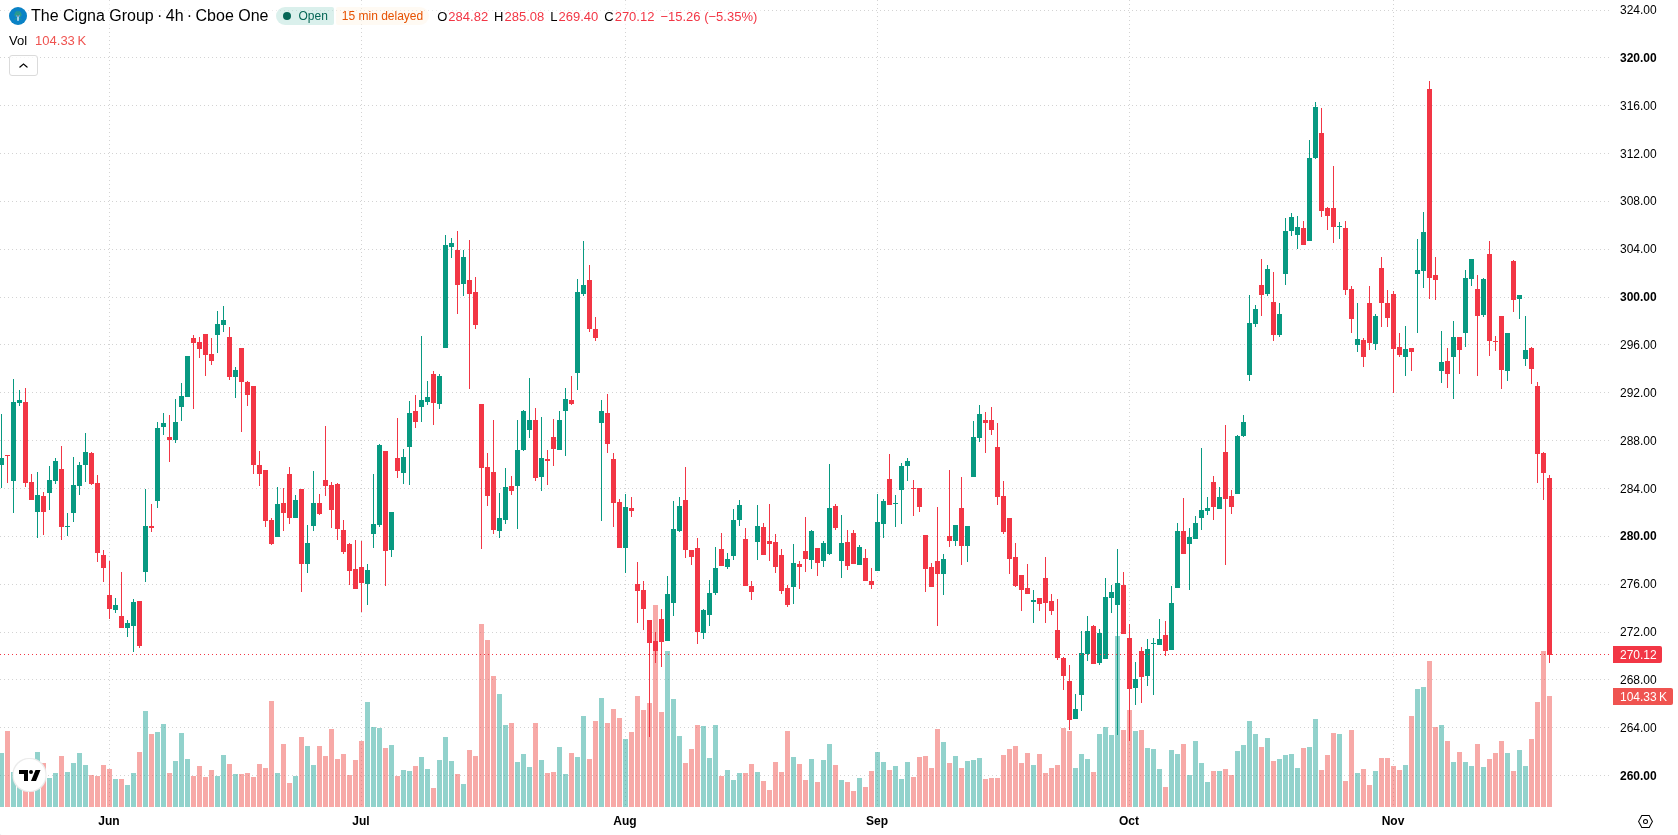
Cigna Corp (CI) fell 5.27% after the company experienced a stock price decline amid regulatory scrutiny, with additional downward pressure from technical trading below all key moving averages. The move is supported by ongoing selling pressure, as CI remains under its 20-day, 50-day, and 200-day moving averages and encounters resistance near $278.99.
 285.08
303.06
Highlights
- Cigna reported adjusted earnings of $7.98 per share on $73.7 billion in revenue and increased its full-year outlook.
- Boston Partners raised its stake by 359,777 shares, bringing its total holding in Cigna to over 2.3 million shares.
- Cigna stock trades under short-, medium-, and long-term moving averages with support at $260.3 and forecasted range of $260.3 to $280.34.
Institutional buying and earnings strength temper breakup pressures
Cigna saw increased institutional interest as Boston Partners acquired an additional 359,777 shares, raising its total stake to over 2.3 million shares. The company reported strong third-quarter results, with adjusted earnings of $7.98 per share on $73.7 billion in revenue, and recently increased its full-year adjusted earnings outlook. Cigna has maintained its dividend policy and is undergoing strategic changes focusing on employer coverage, pharmacy benefits, and cost-saving initiatives under the Accelerate to One program. The most recent trading was also accompanied by regulatory attention, as calls for breaking up large healthcare conglomerates, including Cigna, were made by US lawmakers, though price action has remained under broader selling pressure.
Mixed momentum as bearish trend persists below key supports
Cigna is trading below its 20-day, 50-day, and 200-day moving averages, at $299.14, $288.41, and $283.12 respectively, reflecting sustained downward momentum in short-, medium-, and long-term trends. The nearest resistance stands at $278.99, with support at $260.3, reinforcing the current bearish bias, even as the longer-term 50- and 200-day moving averages remain bullishly aligned. Momentum signals are mixed: the MACD suggests a strong buy, and the ADX also points toward buying strength. The RSI is neutral, while both the Stochastic RSI and Commodity Channel Index are in oversold zones, indicating potential rebound risks. Bear/Bull Power remains negative, confirming sellers dominate intraday momentum. The stock is down $15.05, with intraday volatility at 2.18%, and trades near the session low, as oscillator divergence highlights possible selling exhaustion but shows no confirmed reversal.
Previously it was reported that Cigna faced downside pressure amid growing regulatory scrutiny and technical weakness. The current article adds that institutional accumulation and strategic earnings momentum have so far failed to offset bearish trends, leaving $260.3 as the key support level to monitor for potential further losses.











-
 Afghanistan
-
 Albania
-
 Algeria
-
 Angola
-
 Argentina
-
 Armenia
-
 Australia
-
 Austria
-
 Azerbaijan
-
 Bahamas
-
 Bahrain
-
 Bangladesh
-
 Belarus
-
 Belgium
-
 Bolivia
-
 Botswana
-
 Brazil
-
 Brunei
-
 Bulgaria
-
 Cambodia
-
 Cameroon
-
 Canada
-
 Chile
-
 China
-
 Colombia
-
 Congo
-
 Costa Rica
-
 Cote d'Ivoire
-
 Croatia
-
 Cuba
-
 Cyprus
-
 Czechia
-
 DR Congo
-
 Denmark
-
 Dominican Republic
-
 Ecuador
-
 Egypt
-
 El Salvador
-
 Estonia
-
 Eswatini
-
 Ethiopia
-
 Finland
-
 France
-
 Georgia
-
 Germany
-
 Ghana
-
 Greece
-
 Haiti
-
 Hong Kong
-
 Hungary
-
 India
-
 Indonesia
-
 Iran, Islamic republic
-
 Iraq
-
 Ireland
-
 Israel
-
 Italy
-
 Jamaica
-
 Japan
-
 Jordan
-
 Kazakhstan
-
 Kenya
-
 Korea
-
 Kuwait
-
 Kyrgyzstan
-
 Laos
-
 Latvia
-
 Lebanon
-
 Lesotho
-
 Libya
-
 Lithuania
-
 Luxembourg
-
 Madagascar
-
 Malaysia
-
 Malta
-
 Mauritius
-
 Mexico
-
 Moldova
-
 Mongolia
-
 Montenegro
-
 Morocco
-
 Mozambique
-
 Myanmar
-
 Namibia
-
 Nepal
-
 Netherlands
-
 New Zealand
-
 Nigeria
-
 North Macedonia
-
 Norway
-
 Oman
-
 Pakistan
-
 Palestine
-
 Panama
-
 Papua New Guinea
-
 Paraguay
-
 Peru
-
 Philippines
-
 Poland
-
 Portugal
-
 Puerto Rico
-
 Qatar
-
 Reunion
-
 Romania
-
 Rwanda
-
 Saudi Arabia
-
 Serbia
-
 Singapore
-
 Slovakia
-
 Slovenia
-
 Somalia
-
 South Africa
-
 Spain
-
 Sri Lanka
-
 Sweden
-
 Switzerland
-
 Syria
-
 Taiwan
-
 Tajikistan
-
 Tanzania
-
 Thailand
-
 Trinidad and Tobago
-
 Tunisia
-
 Turkey
-
 UAE
-
 Uganda
-
 Ukraine
-
 United Kingdom
-
United States
-
 Uruguay
-
 Uzbekistan
-
 Venezuela
-
 Vietnam
-
 Yemen
-
 Zambia
-
 Zimbabwe
- Forex
- Crypto












