

What's behind Uber Technologies's latest 6.6% stock pullback?

Uber Technologies, Inc. (UBER) fell 6.57% after its guidance for third-quarter bookings and earnings came in below analyst estimates, following the company’s second-quarter results. The drop is reinforced by a bearish technical structure, with Uber trading below all major moving averages and facing persistent selling pressure.
 66.96
67.47
Highlights
- Uber reported second-quarter revenue of $14.2 billion, up 12%, but issued third-quarter guidance below estimates.
- The company plans more than $10 billion in robotaxi and autonomous vehicle investments, with regulatory and partnership progress ongoing.
- Uber stock fell 6.6%, remains below key averages, and is likely to trade between $64.2 and $69.06 with a slight bearish tilt.
Muted sentiment as investment plans and soft guidance temper revenue growth
Uber reported second-quarter 2026 revenue of $14.2 billion, a 12% increase, with gross bookings up 24% year-over-year to $58 billion. Earnings matched analyst expectations, but the company’s outlook for third-quarter bookings and earnings was below estimates. Uber also outlined plans for over $10 billion in future investments in robotaxi partnerships and autonomous vehicle commercialization, with regulatory and partnership developments noted as ongoing strategic factors.
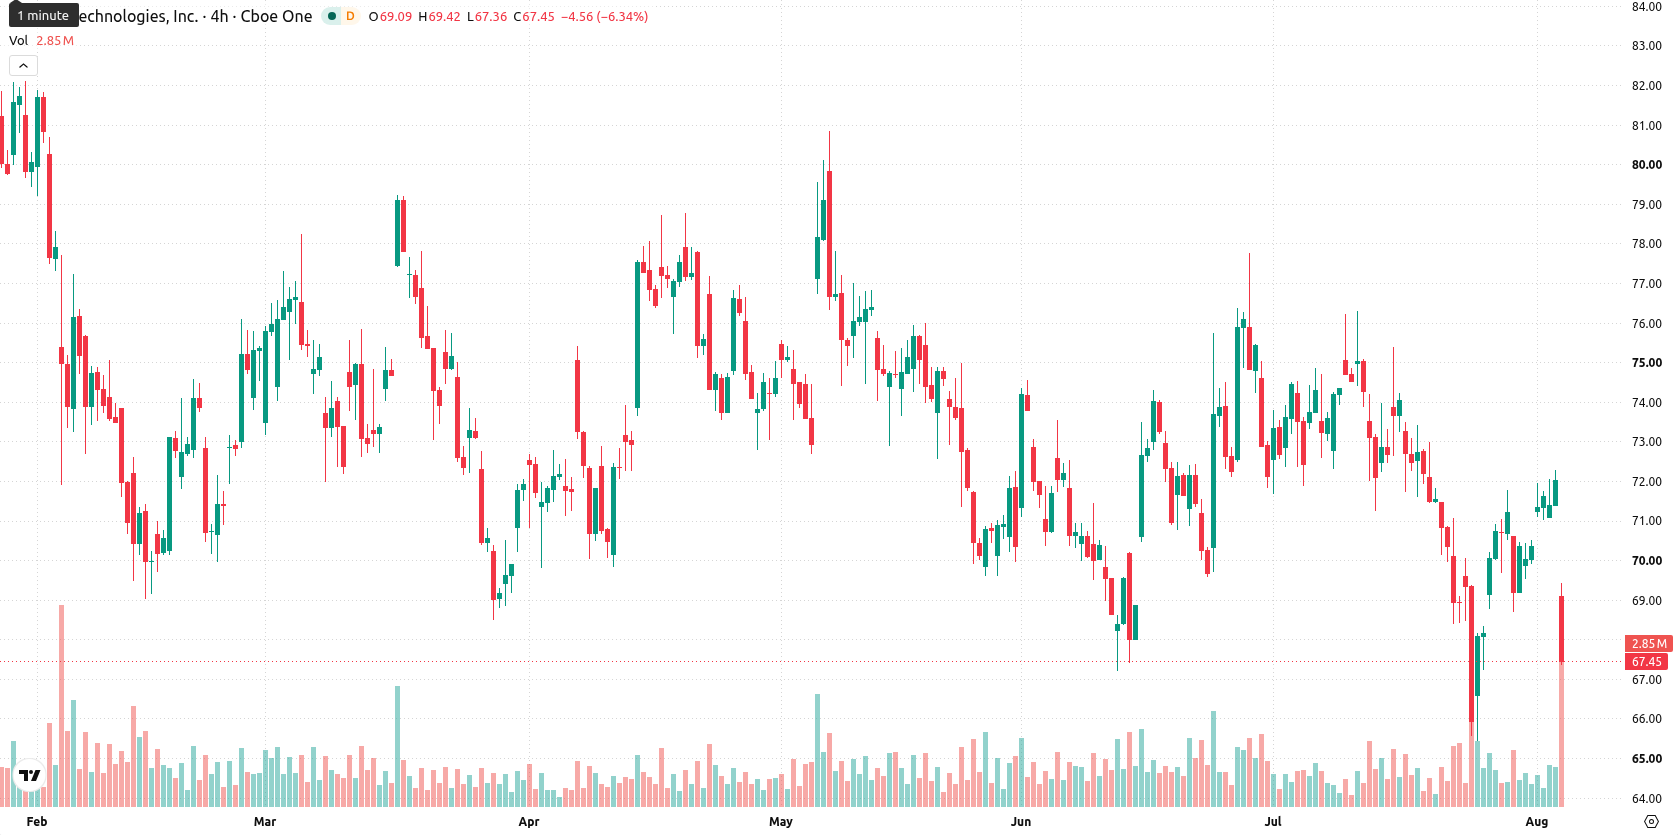
Bearish trend holds as sellers dominate and momentum signals diverge
Uber is trading below the 20-day ($71.57), 50-day ($71.73), and 200-day ($78.35) moving averages, signaling pressure from sellers across short-, medium-, and long-term horizons. The nearest resistance is the near-term ceiling at $67.44, with support seen at the near-term floor of $64.2; the alignment of the 50-day and 200-day averages confirms a bearish medium-term trend. Momentum signals are mixed. The MACD forecasts a strong sell and confirms weak momentum, while the ADX remains neutral, indicating a lack of strong trend. The RSI at 51.61 is signaling a buy, but Stochastic RSI is deeply overbought at 94.3 and Bull/Bear Power is overbought at 1.27, showing buyer dominance in intraday movement. The Commodity Channel Index and Awesome Oscillator are neutral. The stock last traded at $67.26, down $4.73 or 6.57% after opening with a downside gap of about $3.01 (–4.18%). The price is near the daily low, and intraday volatility stands at 2.61%. Tone is pressured after the open, with momentum and oscillators divergently pointing to buyer dominance intraday but underlying trend weakness.
Earlier, analysts noted that Uber was experiencing sustained downside pressure, with technical signals indicating a predominantly bearish outlook. The current analysis reinforces this view with a bearish technical structure and guidance disappointment, making the $64.2 support level a critical point to watch for further downside risk in the near term.









-
 Afghanistan
-
 Albania
-
 Algeria
-
 Angola
-
 Argentina
-
 Armenia
-
 Australia
-
 Austria
-
 Azerbaijan
-
 Bahamas
-
 Bahrain
-
 Bangladesh
-
 Belarus
-
 Belgium
-
 Bolivia
-
 Botswana
-
 Brazil
-
 Brunei
-
 Bulgaria
-
 Cambodia
-
 Cameroon
-
 Canada
-
 Chile
-
 China
-
 Colombia
-
 Congo
-
 Costa Rica
-
 Cote d'Ivoire
-
 Croatia
-
 Cuba
-
 Cyprus
-
 Czechia
-
 DR Congo
-
 Denmark
-
 Dominican Republic
-
 Ecuador
-
 Egypt
-
 El Salvador
-
 Estonia
-
 Eswatini
-
 Ethiopia
-
 Finland
-
 France
-
 Georgia
-
 Germany
-
 Ghana
-
 Greece
-
 Haiti
-
 Hong Kong
-
 Hungary
-
 India
-
 Indonesia
-
 Iran, Islamic republic
-
 Iraq
-
 Ireland
-
 Israel
-
 Italy
-
 Jamaica
-
 Japan
-
 Jordan
-
 Kazakhstan
-
 Kenya
-
 Korea
-
 Kuwait
-
 Kyrgyzstan
-
 Laos
-
 Latvia
-
 Lebanon
-
 Lesotho
-
 Libya
-
 Lithuania
-
 Luxembourg
-
 Madagascar
-
 Malaysia
-
 Malta
-
 Mauritius
-
 Mexico
-
 Moldova
-
 Mongolia
-
 Montenegro
-
 Morocco
-
 Mozambique
-
 Myanmar
-
 Namibia
-
 Nepal
-
 Netherlands
-
 New Zealand
-
 Nigeria
-
 North Macedonia
-
 Norway
-
 Oman
-
 Pakistan
-
 Palestine
-
 Panama
-
 Papua New Guinea
-
 Paraguay
-
 Peru
-
 Philippines
-
 Poland
-
 Portugal
-
 Puerto Rico
-
 Qatar
-
 Reunion
-
 Romania
-
 Rwanda
-
 Saudi Arabia
-
 Serbia
-
 Singapore
-
 Slovakia
-
 Slovenia
-
 Somalia
-
 South Africa
-
 Spain
-
 Sri Lanka
-
 Sweden
-
 Switzerland
-
 Syria
-
 Taiwan
-
 Tajikistan
-
 Tanzania
-
 Thailand
-
 Trinidad and Tobago
-
 Tunisia
-
 Turkey
-
 UAE
-
 Uganda
-
 Ukraine
-
 United Kingdom
-
United States
-
 Uruguay
-
 Uzbekistan
-
 Venezuela
-
 Vietnam
-
 Yemen
-
 Zambia
-
 Zimbabwe
- Forex
- Crypto












