

Uber stock weekly forecast: Sellers keep pressure as shares consolidate below resistance

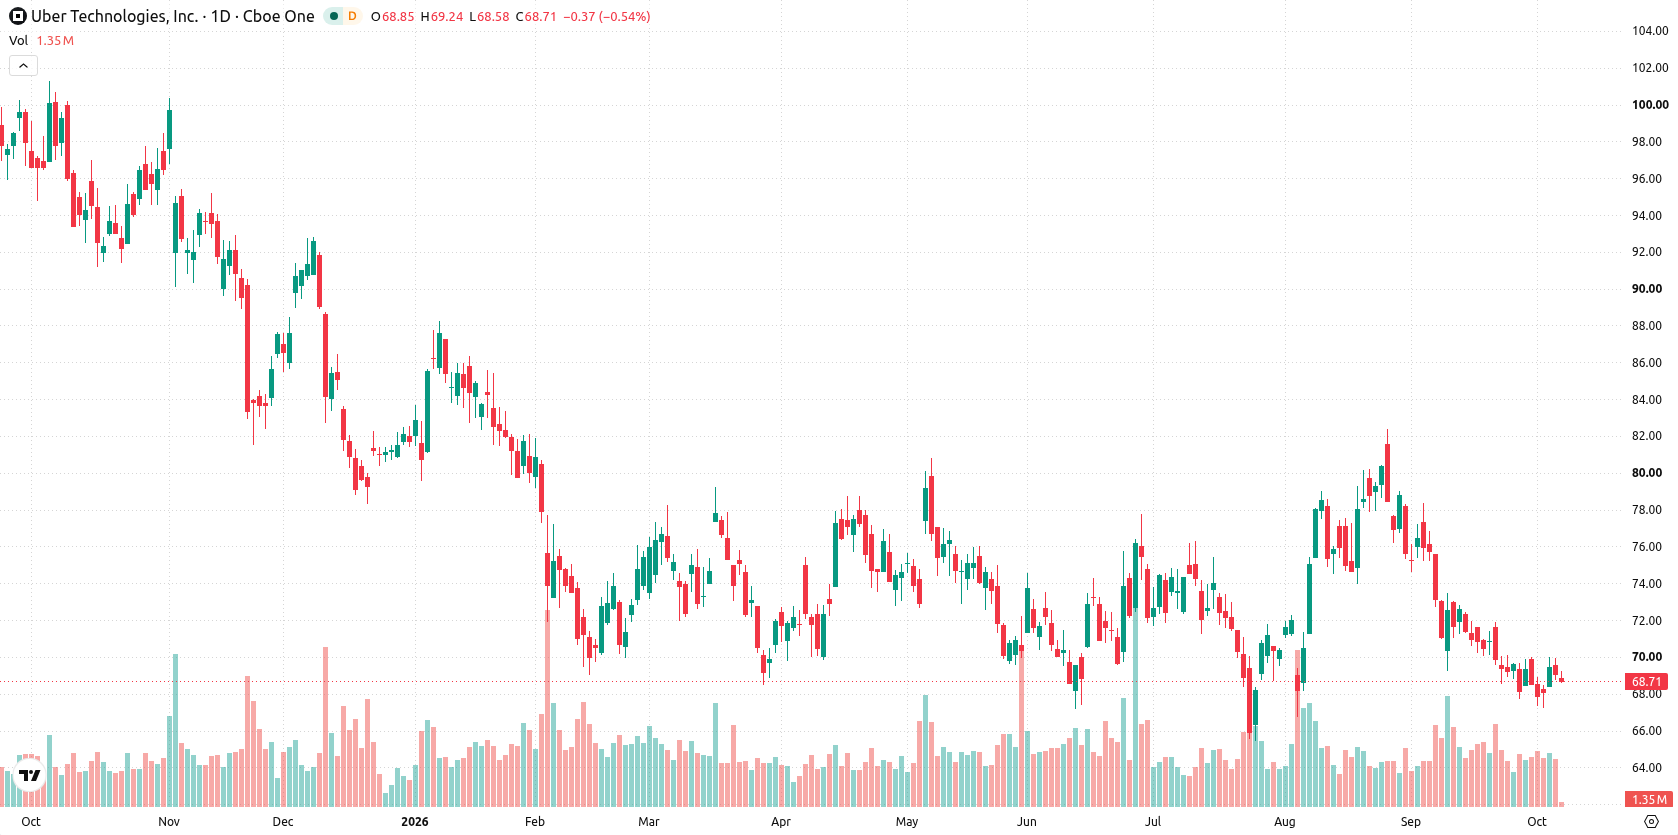
Shares of Uber Technologies, Inc. (UBER) are trading near $68.60 as sellers keep pressure on the stock despite little movement over the past week. With consolidation taking hold, investors will be watching whether short-term weakness continues in the days ahead.
 65.76
66.82
Highlights
- Shares of Uber closed at $68.61 and remain below key moving averages, with a bearish long-term technical structure.
- The price action shows consolidation in a narrow range, with technical indicators split between overbought readings and persistent weakness.
- Expected five-day range is $64.53 to $69.83, with 72% probability of a decline if support at $67.28 breaks.
Expansion moves and acquisitions reshape demand outlook over the week
Uber announced on October 6, 2026, that it will acquire the corporate catering platform ezCater in an all-cash deal worth $2.3 billion, according to Bloomberg. The acquisition is aimed at expanding Uber Eats' reach into the corporate dining space, which could shift demand expectations for Uber's delivery segment in the week ahead. In addition, Uber expanded its partnership with Costco, increasing Uber Eats access to 47 states, and scheduled its third quarter 2026 earnings call for November 4, 2026.
Flat momentum and overbought RSI highlight stalled upside during the week
The daily chart setup indicates a period of consolidation, with the trend strength reading as flat and momentum character described as a contained move within a narrow range. Despite the Stochastic RSI registering as overbought at 82.35, both the MACD (Strong Sell) and Bull/Bear Power (Oversold) continue to flag weakness. Volatility over the past week reached 4.06%. Nearest support is at $67.28, with resistance at $70.01 and the Ichimoku Kijun at $72.85 acting as additional overhead resistance.
Bearish bias dominates outlook as range-bound trade expected next week
For the next five trading days, the expected range is $64.53 to $69.83, with a 28% probability of an increase and a 72% probability of a decrease. The base case calls for continued consolidation within this band, given the lingering bearish signals and absence of a clear trend. Should shares break above resistance at $70.01, a move toward the upper end of the range is possible. If support at $67.28 fails, the stock could test the lower limit near $64.53.
Previously it was reported that Uber agreed to acquire the corporate catering platform ezCater for $2.3 billion in cash to strengthen its food delivery segment. While this strategic move introduces new growth potential, traders should watch for a decisive break above resistance at $70.01 or a failure of support at $67.28 to clarify the next directional move.






Latest Uber News





-
 Afghanistan
-
 Albania
-
 Algeria
-
 Angola
-
 Argentina
-
 Armenia
-
 Australia
-
 Austria
-
 Azerbaijan
-
 Bahamas
-
 Bahrain
-
 Bangladesh
-
 Belarus
-
 Belgium
-
 Bolivia
-
 Botswana
-
 Brazil
-
 Brunei
-
 Bulgaria
-
 Cambodia
-
 Cameroon
-
 Canada
-
 Chile
-
 China
-
 Colombia
-
 Congo
-
 Costa Rica
-
 Cote d'Ivoire
-
 Croatia
-
 Cuba
-
 Cyprus
-
 Czechia
-
 DR Congo
-
 Denmark
-
 Dominican Republic
-
 Ecuador
-
 Egypt
-
 El Salvador
-
 Estonia
-
 Eswatini
-
 Ethiopia
-
 Finland
-
 France
-
 Georgia
-
 Germany
-
 Ghana
-
 Greece
-
 Haiti
-
 Hong Kong
-
 Hungary
-
 India
-
 Indonesia
-
 Iran, Islamic republic
-
 Iraq
-
 Ireland
-
 Israel
-
 Italy
-
 Jamaica
-
 Japan
-
 Jordan
-
 Kazakhstan
-
 Kenya
-
 Korea
-
 Kuwait
-
 Kyrgyzstan
-
 Laos
-
 Latvia
-
 Lebanon
-
 Lesotho
-
 Libya
-
 Lithuania
-
 Luxembourg
-
 Madagascar
-
 Malaysia
-
 Malta
-
 Mauritius
-
 Mexico
-
 Moldova
-
 Mongolia
-
 Montenegro
-
 Morocco
-
 Mozambique
-
 Myanmar
-
 Namibia
-
 Nepal
-
 Netherlands
-
 New Zealand
-
 Nigeria
-
 North Macedonia
-
 Norway
-
 Oman
-
 Pakistan
-
 Palestine
-
 Panama
-
 Papua New Guinea
-
 Paraguay
-
 Peru
-
 Philippines
-
 Poland
-
 Portugal
-
 Puerto Rico
-
 Qatar
-
 Reunion
-
 Romania
-
 Rwanda
-
 Saudi Arabia
-
 Serbia
-
 Singapore
-
 Slovakia
-
 Slovenia
-
 Somalia
-
 South Africa
-
 Spain
-
 Sri Lanka
-
 Sweden
-
 Switzerland
-
 Syria
-
 Taiwan
-
 Tajikistan
-
 Tanzania
-
 Thailand
-
 Trinidad and Tobago
-
 Tunisia
-
 Turkey
-
 UAE
-
 Uganda
-
 Ukraine
-
 United Kingdom
-
United States
-
 Uruguay
-
 Uzbekistan
-
 Venezuela
-
 Vietnam
-
 Yemen
-
 Zambia
-
 Zimbabwe
- Forex
- Crypto












