

CleanSpark stock weak momentum: Technical outlook

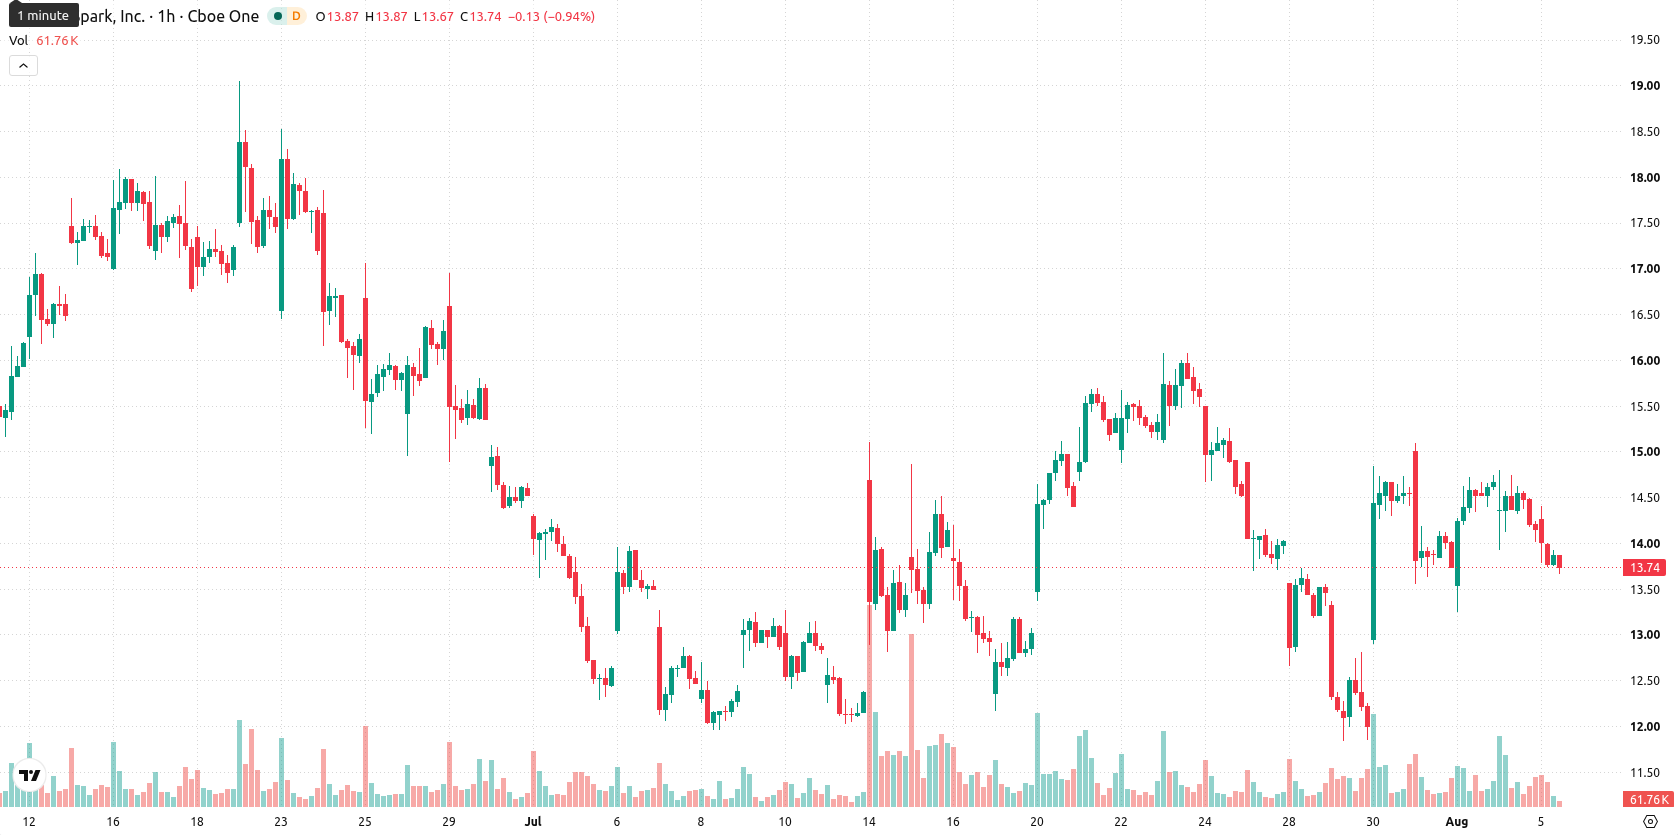
CleanSpark (CLSK) stock is trading at $13.76, down 2.93% for the day in a session marked by high volatility. The price remains near the session’s lows and is currently below its main short- and medium-term moving averages, with long-term support still intact.
 6.41
7.35
Highlights
- CleanSpark secured long-term operational control of its Sandersville, Georgia data center through a 20-year triple-net lease valued at $6.6 billion in contracted revenue.
- As of July 2026, CleanSpark operated at 50 exahashes per second with 230,507 miners and held 13,931 Bitcoin, with over 4,000 posted as collateral or tied to derivative contracts.
- Shares of CleanSpark face sustained selling pressure, with price forecast to consolidate between $12.87 and $14.65 amid oversold short-term signals and weak momentum.
Contracted revenue stabilizes operations amid ongoing selling pressure
CleanSpark entered into a 20-year triple-net lease for its Sandersville, Georgia data center campus, a transaction valued at $6.6 billion in contracted revenue, according to Investing.com. This agreement secures long-term operational control over a key site and is expected to provide stable, predictable income through the extended lease term. Additional data from Stocktwits confirmed that as of July 31, 2026, CleanSpark operated at 50 exahashes per second, with 230,507 miners deployed and more than 1.8 GW of infrastructure in place, while July 2026 figures highlighted a total of 586 Bitcoin mined and 13,931 Bitcoin held, with 4,070 posted as collateral or receivable related to derivative transactions, as noted by Investing.com, though price action has remained under broader selling pressure.
Short-term bearish signals as sellers dominate below key averages
CLSK is trading beneath the MA-20 and MA-50 on the hourly timeframe, but remains above the daily MA-200. The Ichimoku Kijun at $14.16 is acting as immediate resistance to any rally attempts. Price action is being shaped by short- and medium-term moving average crossovers favoring sellers, while the daily MA-200 is providing a longer-term support zone. RSI stands at 42.36 and signals a sell bias, with the Stoch RSI and CCI both indicating oversold conditions. MACD, ADX, and the Awesome Oscillator all remain Neutral, while Bull/Bear Power points to seller dominance within intraday trading.
Downside risk prevails unless resistance clears amid high volatility
In the near term, CLSK is forecast to move within a range defined by $12.87 on the downside and $14.65 as the upper bound, reflecting the asset’s current volatility band. There is a very high probability of further downside, with recovery scenarios considered very unlikely. The baseline expectation calls for continued consolidation inside this range. Should price break above the $14.16 resistance, a move toward $14.65 may develop, while a sustained drop below $12.87 could accelerate downside momentum.
Earlier, analysts noted that CleanSpark’s technical outlook was marked by cautious optimism as long as key supports held amidst mixed signals. With the current price action breaking below short- and medium-term averages and technical indicators turning more negative, traders should closely watch for a potential test of the $12.87 support, which could trigger further downside if breached.






Latest CleanSpark News



-
 Afghanistan
-
 Albania
-
 Algeria
-
 Angola
-
 Argentina
-
 Armenia
-
 Australia
-
 Austria
-
 Azerbaijan
-
 Bahamas
-
 Bahrain
-
 Bangladesh
-
 Belarus
-
 Belgium
-
 Bolivia
-
 Botswana
-
 Brazil
-
 Brunei
-
 Bulgaria
-
 Cambodia
-
 Cameroon
-
 Canada
-
 Chile
-
 China
-
 Colombia
-
 Congo
-
 Costa Rica
-
 Cote d'Ivoire
-
 Croatia
-
 Cuba
-
 Cyprus
-
 Czechia
-
 DR Congo
-
 Denmark
-
 Dominican Republic
-
 Ecuador
-
 Egypt
-
 El Salvador
-
 Estonia
-
 Eswatini
-
 Ethiopia
-
 Finland
-
 France
-
 Georgia
-
 Germany
-
 Ghana
-
 Greece
-
 Haiti
-
 Hong Kong
-
 Hungary
-
 India
-
 Indonesia
-
 Iran, Islamic republic
-
 Iraq
-
 Ireland
-
 Israel
-
 Italy
-
 Jamaica
-
 Japan
-
 Jordan
-
 Kazakhstan
-
 Kenya
-
 Korea
-
 Kuwait
-
 Kyrgyzstan
-
 Laos
-
 Latvia
-
 Lebanon
-
 Lesotho
-
 Libya
-
 Lithuania
-
 Luxembourg
-
 Madagascar
-
 Malaysia
-
 Malta
-
 Mauritius
-
 Mexico
-
 Moldova
-
 Mongolia
-
 Montenegro
-
 Morocco
-
 Mozambique
-
 Myanmar
-
 Namibia
-
 Nepal
-
 Netherlands
-
 New Zealand
-
 Nigeria
-
 North Macedonia
-
 Norway
-
 Oman
-
 Pakistan
-
 Palestine
-
 Panama
-
 Papua New Guinea
-
 Paraguay
-
 Peru
-
 Philippines
-
 Poland
-
 Portugal
-
 Puerto Rico
-
 Qatar
-
 Reunion
-
 Romania
-
 Rwanda
-
 Saudi Arabia
-
 Serbia
-
 Singapore
-
 Slovakia
-
 Slovenia
-
 Somalia
-
 South Africa
-
 Spain
-
 Sri Lanka
-
 Sweden
-
 Switzerland
-
 Syria
-
 Taiwan
-
 Tajikistan
-
 Tanzania
-
 Thailand
-
 Trinidad and Tobago
-
 Tunisia
-
 Turkey
-
 UAE
-
 Uganda
-
 Ukraine
-
 United Kingdom
-
United States
-
 Uruguay
-
 Uzbekistan
-
 Venezuela
-
 Vietnam
-
 Yemen
-
 Zambia
-
 Zimbabwe
- Forex
- Crypto












