

Boston Scientific stock forecast: Support test underway after recent pullback

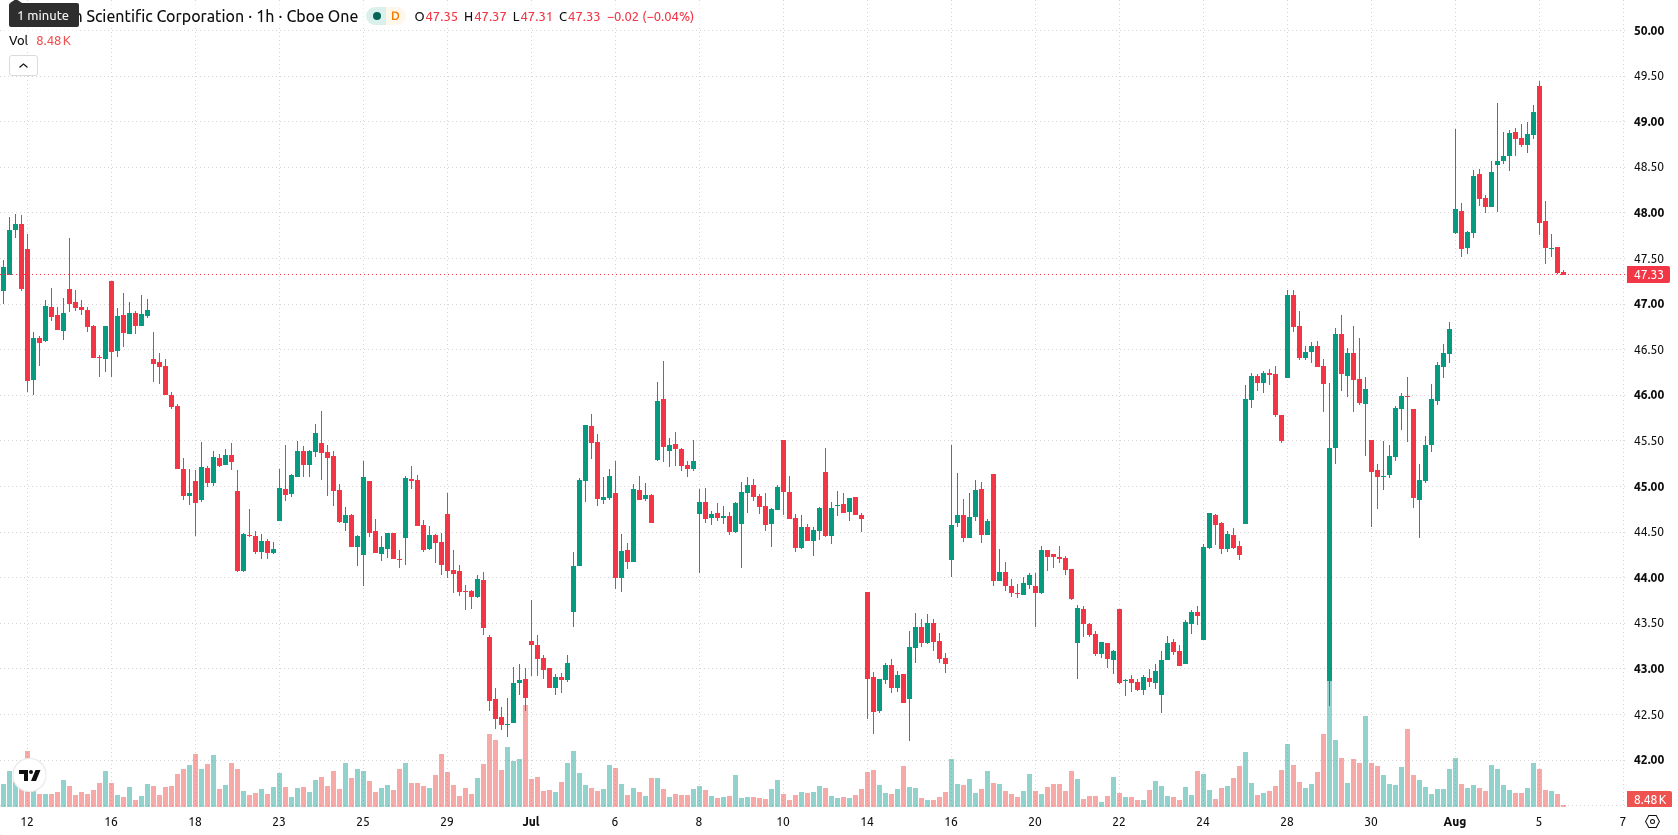
Boston Scientific (BSX) stock is trading at $47.29 after a sharp decline of 3.68% on the day. The stock currently sits below its short-term moving average and remains within a mixed zone relative to its longer-term averages.
 43.25
45.34
Highlights
- BSX stock closed sharply lower at $47.29, falling 3.68% on elevated volatility and ending near the session low.
- Technical momentum signals are mixed, with bearish pressure from oscillators and persistent downside trend signals outweighing modest bullish momentum.
- If BSX breaks below $45.16, selling may accelerate, while resistance stands at $49.42 with likely rangebound trading in between.
Momentum mixed as support tested and sellers prevail
On the H1 chart, BSX is positioned below the MA-20 while remaining above the MA-50, but is trading well under the long-term MA-200. The Ichimoku Kijun at $46.82 offers immediate support. Momentum indicators paint a mixed technical picture: MACD shows strong buying interest, but ADX reveals only a modest bullish bias. Both RSI and CCI lean toward a Sell signal, with Stochastic RSI deeply oversold, hinting at possible exhaustion of current downward momentum. Bull/Bear Power indicates intraday seller dominance, and the Awesome Oscillator is neutral with no clear reinforcement of the prevailing move.
Sideways bias as breakout levels define volatility band
Over the next several trading sessions, BSX is expected to fluctuate within the $45.16 to $49.42 range, which reflects a volatility band relative to current levels. The most likely scenario is sideways movement within this band. A breakout above $49.42 could trigger short-covering, while a drop below $45.16 may accelerate further selling.
Earlier, analysts noted that Boston Scientific was exhibiting persistent bearish signals, with technical indicators and price action suggesting continued downward pressure. The current mixed technical readings and intraday volatility suggest traders should watch for a decisive move beyond either end of the $45.16 to $49.42 range to indicate the next directional trend.






Latest Boston Scientific News




-
 Afghanistan
-
 Albania
-
 Algeria
-
 Angola
-
 Argentina
-
 Armenia
-
 Australia
-
 Austria
-
 Azerbaijan
-
 Bahamas
-
 Bahrain
-
 Bangladesh
-
 Belarus
-
 Belgium
-
 Bolivia
-
 Botswana
-
 Brazil
-
 Brunei
-
 Bulgaria
-
 Cambodia
-
 Cameroon
-
 Canada
-
 Chile
-
 China
-
 Colombia
-
 Congo
-
 Costa Rica
-
 Cote d'Ivoire
-
 Croatia
-
 Cuba
-
 Cyprus
-
 Czechia
-
 DR Congo
-
 Denmark
-
 Dominican Republic
-
 Ecuador
-
 Egypt
-
 El Salvador
-
 Estonia
-
 Eswatini
-
 Ethiopia
-
 Finland
-
 France
-
 Georgia
-
 Germany
-
 Ghana
-
 Greece
-
 Haiti
-
 Hong Kong
-
 Hungary
-
 India
-
 Indonesia
-
 Iran, Islamic republic
-
 Iraq
-
 Ireland
-
 Israel
-
 Italy
-
 Jamaica
-
 Japan
-
 Jordan
-
 Kazakhstan
-
 Kenya
-
 Korea
-
 Kuwait
-
 Kyrgyzstan
-
 Laos
-
 Latvia
-
 Lebanon
-
 Lesotho
-
 Libya
-
 Lithuania
-
 Luxembourg
-
 Madagascar
-
 Malaysia
-
 Malta
-
 Mauritius
-
 Mexico
-
 Moldova
-
 Mongolia
-
 Montenegro
-
 Morocco
-
 Mozambique
-
 Myanmar
-
 Namibia
-
 Nepal
-
 Netherlands
-
 New Zealand
-
 Nigeria
-
 North Macedonia
-
 Norway
-
 Oman
-
 Pakistan
-
 Palestine
-
 Panama
-
 Papua New Guinea
-
 Paraguay
-
 Peru
-
 Philippines
-
 Poland
-
 Portugal
-
 Puerto Rico
-
 Qatar
-
 Reunion
-
 Romania
-
 Rwanda
-
 Saudi Arabia
-
 Serbia
-
 Singapore
-
 Slovakia
-
 Slovenia
-
 Somalia
-
 South Africa
-
 Spain
-
 Sri Lanka
-
 Sweden
-
 Switzerland
-
 Syria
-
 Taiwan
-
 Tajikistan
-
 Tanzania
-
 Thailand
-
 Trinidad and Tobago
-
 Tunisia
-
 Turkey
-
 UAE
-
 Uganda
-
 Ukraine
-
 United Kingdom
-
United States
-
 Uruguay
-
 Uzbekistan
-
 Venezuela
-
 Vietnam
-
 Yemen
-
 Zambia
-
 Zimbabwe
- Forex
- Crypto












