

What's behind Celanese's latest stock pullback?

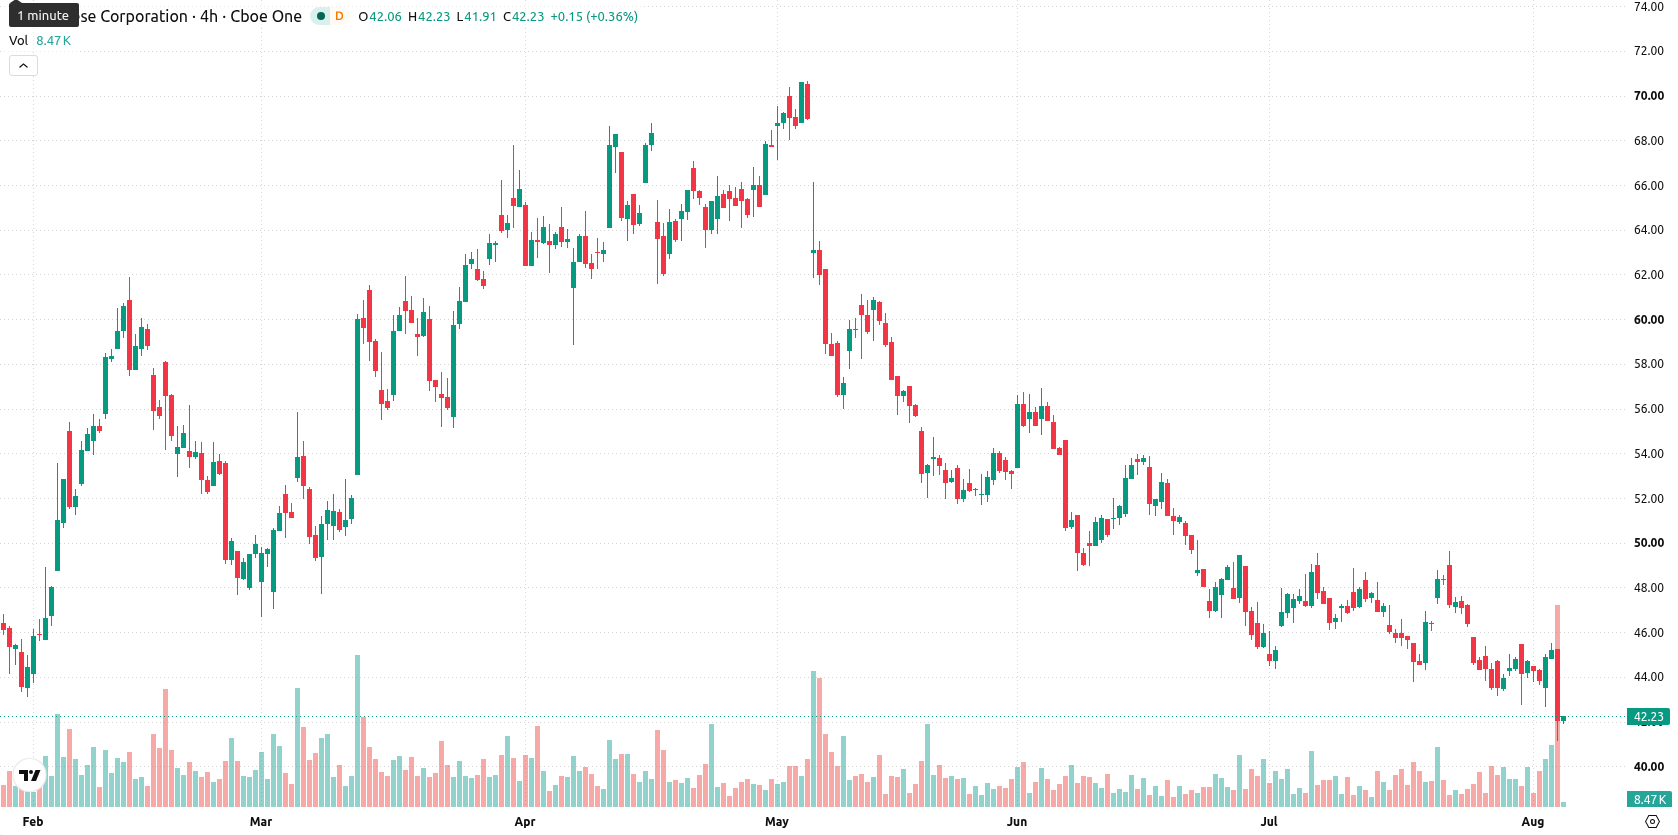
Celanese Corporation (CE) fell 6.68% after reporting second-quarter 2026 earnings, with earnings per share and guidance released alongside a small dividend declaration. The decline is reinforced by the stock remaining below its 20-day, 50-day, and 200-day moving averages, with persistent seller pressure in the short, medium, and long term.
 44.79
46.03
44.79
46.03
Highlights
- Celanese reported second-quarter 2026 net sales of $2.8 billion, up 18% sequentially, with adjusted EPS at $2.45.
- Despite improved earnings and a $0.03 per share dividend announcement, shares remain under significant selling pressure.
- Celanese stock trades below key moving averages with bearish momentum, projected to range from $38.34 to $43.66 in the coming days.
Net sales growth offset as market discounts earnings and dividend news
Celanese Corporation reported second-quarter 2026 results, with U.S. GAAP diluted earnings per share of $1.15 from continuing operations and adjusted EPS of $2.45. Net sales reached $2.8 billion, rising 18% sequentially. The company also declared a $0.03 per share dividend payable on August 10, 2026, though price action has remained under broader selling pressure.
Bearish momentum confirmed by technical alignment and mixed indicators
CE is trading below the $45.94 MA-20, $48.86 MA-50, and $50.14 MA-200, which indicates ongoing downside pressure across all timeframes. Near-term resistance stands at $42.64, and immediate support is noted at the recent low of $41.18. The MA-50 versus MA-200 alignment confirms a continued bearish trend. Momentum indicators are collectively bearish: MACD signals a strong sell, ADX suggests weak trend strength, and RSI, CCI, and Stochastic RSI show mixed readings with most leaning sell or oversold, and a brief intraday tilt toward buyers. Price action is near session lows with intraday volatility at 8.06%, reflecting strong negative momentum.
Earlier, analysts noted that Celanese was trapped in a sustained downtrend, with technical weakness driving continued selling pressure. The latest earnings release and persistent bearish signals strengthen this downside scenario, with traders now focused on whether support near $41.18 can hold to prevent a further move toward the $38.34 level.





Latest Celanese Corporation News





-
 Afghanistan
-
 Albania
-
 Algeria
-
 Angola
-
 Argentina
-
 Armenia
-
 Australia
-
 Austria
-
 Azerbaijan
-
 Bahamas
-
 Bahrain
-
 Bangladesh
-
 Belarus
-
 Belgium
-
 Bolivia
-
 Botswana
-
 Brazil
-
 Brunei
-
 Bulgaria
-
 Cambodia
-
 Cameroon
-
 Canada
-
 Chile
Chile
-
 China
China
-
 Colombia
-
 Congo
Congo
-
 Costa Rica
-
 Cote d'Ivoire
-
 Croatia
-
 Cuba
Cuba
-
 Cyprus
-
 Czechia
-
 DR Congo
-
 Denmark
-
 Dominican Republic
-
 Ecuador
-
 Egypt
Egypt
-
 El Salvador
-
 Estonia
-
 Eswatini
-
 Ethiopia
-
 Finland
-
 France
-
 Georgia
-
 Germany
-
 Ghana
Ghana
-
 Greece
-
 Haiti
Haiti
-
 Hong Kong
-
 Hungary
-
 India
India
-
 Indonesia
-
 Iran, Islamic republic
-
 Iraq
Iraq
-
 Ireland
-
 Israel
-
 Italy
Italy
-
 Jamaica
-
 Japan
Japan
-
 Jordan
-
 Kazakhstan
-
 Kenya
Kenya
-
 Korea
Korea
-
 Kuwait
-
 Kyrgyzstan
-
 Laos
Laos
-
 Latvia
-
 Lebanon
-
 Lesotho
-
 Libya
Libya
-
 Lithuania
-
 Luxembourg
-
 Madagascar
-
 Malaysia
-
 Malta
Malta
-
 Mauritius
-
 Mexico
-
 Moldova
-
 Mongolia
-
 Montenegro
-
 Morocco
-
 Mozambique
-
 Myanmar
-
 Namibia
-
 Nepal
Nepal
-
 Netherlands
-
 New Zealand
-
 Nigeria
-
 North Macedonia
-
 Norway
-
 Oman
Oman
-
 Pakistan
-
 Palestine
-
 Panama
-
 Papua New Guinea
-
 Paraguay
-
 Peru
Peru
-
 Philippines
-
 Poland
-
 Portugal
-
 Puerto Rico
-
 Qatar
Qatar
-
 Reunion
-
 Romania
-
 Rwanda
-
 Saudi Arabia
-
 Serbia
-
 Singapore
-
 Slovakia
-
 Slovenia
-
 Somalia
-
 South Africa
-
 Spain
Spain
-
 Sri Lanka
-
 Sweden
-
 Switzerland
-
 Syria
Syria
-
 Taiwan
-
 Tajikistan
-
 Tanzania
-
 Thailand
-
 Trinidad and Tobago
-
 Tunisia
-
 Turkey
-
 UAE
UAE
-
 Uganda
-
 Ukraine
-
 United Kingdom
-
United States
-
 Uruguay
-
 Uzbekistan
-
 Venezuela
-
 Vietnam
-
 Yemen
Yemen
-
 Zambia
-
 Zimbabwe
- Forex
- Crypto












