

Gilead Sciences shares technical analysis: Pullback signals pressure as sellers dominate near term

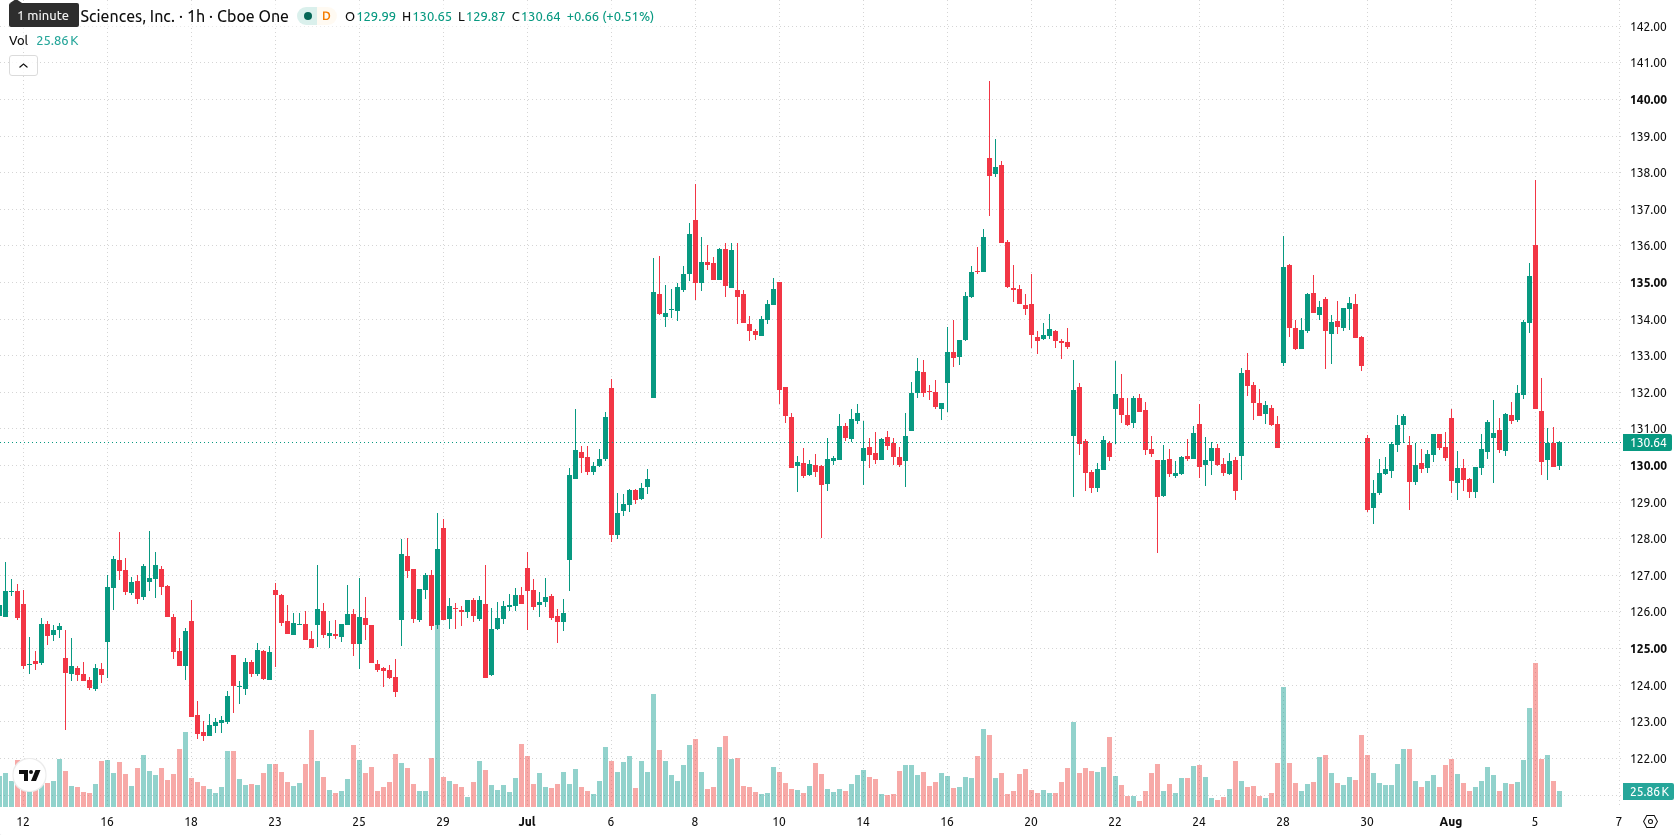
Gilead Sciences (GILD) stock is trading at $130.32, down 3.65% for the latest session. The move leaves the stock positioned below its short- and long-term moving averages, with price action closing near the session low amid heightened volatility.
 165.67
160.83
Highlights
- Gilead Sciences reported second-quarter 2026 revenue of $7.80 billion, surpassing consensus with robust sales in core therapies like Biktarvy.
- The California Supreme Court ruled in Gilead Sciences' favor, removing a major litigation risk for the company.
- Gilead Sciences stock trades below key moving averages with persistent selling pressure; price is likely to consolidate between $127.06 and $134.79.
Strong revenue and legal win offset by continued selling pressure
Gilead Sciences reported second-quarter 2026 revenue of $7.80 billion, topping the FactSet consensus and reflecting strong operational performance according to Marketscreener. Product sales, excluding Veklury, rose 10% year-over-year to $7.6 billion, while Biospace highlighted a 7% increase in Biktarvy sales to $3.8 billion, underscoring ongoing demand for core therapies. In addition, the California Supreme Court ruled in favor of Gilead Sciences on August 3, ending a prolonged legal dispute and removing a major litigation risk, as reported by Medicaldaily. Despite these positive developments, price action has remained under broader selling pressure.
Bearish bias as all key averages cap GILD and momentum weakens
GILD is trading below its MA-20 at $130.92, MA-50 at $131.58, and MA-200 at $131.92, confirming resistance at all tracked moving averages. The Ichimoku Kijun is set at $133.16, serving as the nearest overhead barrier for any attempted rebound. RSI is at 44.96 and signals Sell, with CCI also in Sell territory, while Stochastic RSI is oversold. MACD and ADX both indicate a Neutral stance, but Bull/Bear Power confirms sellers are dominant on the intraday chart. Most oscillators align with bearish momentum, though the absence of strong signals from MACD and Awesome Oscillator introduces mild divergence.
Consolidation likely as downside risk outweighs breakout chances
Over the short term, price is expected to trade within a $127.06 to $134.79 range, consistent with current volatility. The probability of an upward breakout is estimated at 24%, with the downside scenario remaining more likely should selling pressure persist. The baseline expectation is for GILD to consolidate within this band, while a decisive move above resistance would be required for any sustained bullish reversal. If the lower bound fails, the path opens for deeper pullbacks.
Earlier, analysts noted that Gilead Sciences was weighed down by persistent technical resistance and conflicted momentum despite solid earnings growth. The current analysis adds a new dimension with the removal of a major legal overhang, suggesting that traders should monitor the $127.06 to $134.79 range for a potential inflection point as technical barriers and volatility remain key factors.






Latest Gilead Sciences News



-
 Afghanistan
-
 Albania
-
 Algeria
-
 Angola
-
 Argentina
-
 Armenia
-
 Australia
-
 Austria
-
 Azerbaijan
-
 Bahamas
-
 Bahrain
-
 Bangladesh
-
 Belarus
-
 Belgium
-
 Bolivia
-
 Botswana
-
 Brazil
-
 Brunei
-
 Bulgaria
-
 Cambodia
-
 Cameroon
-
 Canada
-
 Chile
-
 China
-
 Colombia
-
 Congo
-
 Costa Rica
-
 Cote d'Ivoire
-
 Croatia
-
 Cuba
-
 Cyprus
-
 Czechia
-
 DR Congo
-
 Denmark
-
 Dominican Republic
-
 Ecuador
-
 Egypt
-
 El Salvador
-
 Estonia
-
 Eswatini
-
 Ethiopia
-
 Finland
-
 France
-
 Georgia
-
 Germany
-
 Ghana
-
 Greece
-
 Haiti
-
 Hong Kong
-
 Hungary
-
 India
-
 Indonesia
-
 Iran, Islamic republic
-
 Iraq
-
 Ireland
-
 Israel
-
 Italy
-
 Jamaica
-
 Japan
-
 Jordan
-
 Kazakhstan
-
 Kenya
-
 Korea
-
 Kuwait
-
 Kyrgyzstan
-
 Laos
-
 Latvia
-
 Lebanon
-
 Lesotho
-
 Libya
-
 Lithuania
-
 Luxembourg
-
 Madagascar
-
 Malaysia
-
 Malta
-
 Mauritius
-
 Mexico
-
 Moldova
-
 Mongolia
-
 Montenegro
-
 Morocco
-
 Mozambique
-
 Myanmar
-
 Namibia
-
 Nepal
-
 Netherlands
-
 New Zealand
-
 Nigeria
-
 North Macedonia
-
 Norway
-
 Oman
-
 Pakistan
-
 Palestine
-
 Panama
-
 Papua New Guinea
-
 Paraguay
-
 Peru
-
 Philippines
-
 Poland
-
 Portugal
-
 Puerto Rico
-
 Qatar
-
 Reunion
-
 Romania
-
 Rwanda
-
 Saudi Arabia
-
 Serbia
-
 Singapore
-
 Slovakia
-
 Slovenia
-
 Somalia
-
 South Africa
-
 Spain
-
 Sri Lanka
-
 Sweden
-
 Switzerland
-
 Syria
-
 Taiwan
-
 Tajikistan
-
 Tanzania
-
 Thailand
-
 Trinidad and Tobago
-
 Tunisia
-
 Turkey
-
 UAE
-
 Uganda
-
 Ukraine
-
 United Kingdom
-
United States
-
 Uruguay
-
 Uzbekistan
-
 Venezuela
-
 Vietnam
-
 Yemen
-
 Zambia
-
 Zimbabwe
- Forex
- Crypto












