

Caterpillar shares see nearly 7% weekly gain as strong resistance continues to block breakout: weekly analysis

Shares of Caterpillar, Inc. (CAT) are trading near $870 after a robust week, climbing roughly 6% as a tug-of-war between momentum signals and resistance lines keeps direction uncertain. The chart reveals mixed technicals — strong selling pressure contrasts with overbought conditions, framing a near-term standoff. Traders will be watching to see if resistance continues to cap further gains or if a breakout attempt emerges in the days ahead.
 627.14
722.51
Highlights
- Shares of Caterpillar gained 6.2% over the past week but currently trade below key short-term moving averages.
- The stock remains in a flat trend with heightened volatility and mixed momentum signals, suggesting market indecision.
- Expected five-day trading range is $789.5 to $927.91, with base case favoring consolidation between $804.57 and $877.73.
Record revenue and data center demand boost sentiment this week
Caterpillar Inc. reported record second-quarter 2026 revenue of $20.5 billion, according to a press release distributed by PR Newswire and filings cited by StockTitan. The company also boosted its full-year sales outlook after higher operating margins and increased profit per share. According to CNBC, demand for construction equipment tied to nationwide data center buildouts continues to drive these results, while Caterpillar returned $2.2 billion to shareholders through buybacks and dividends.
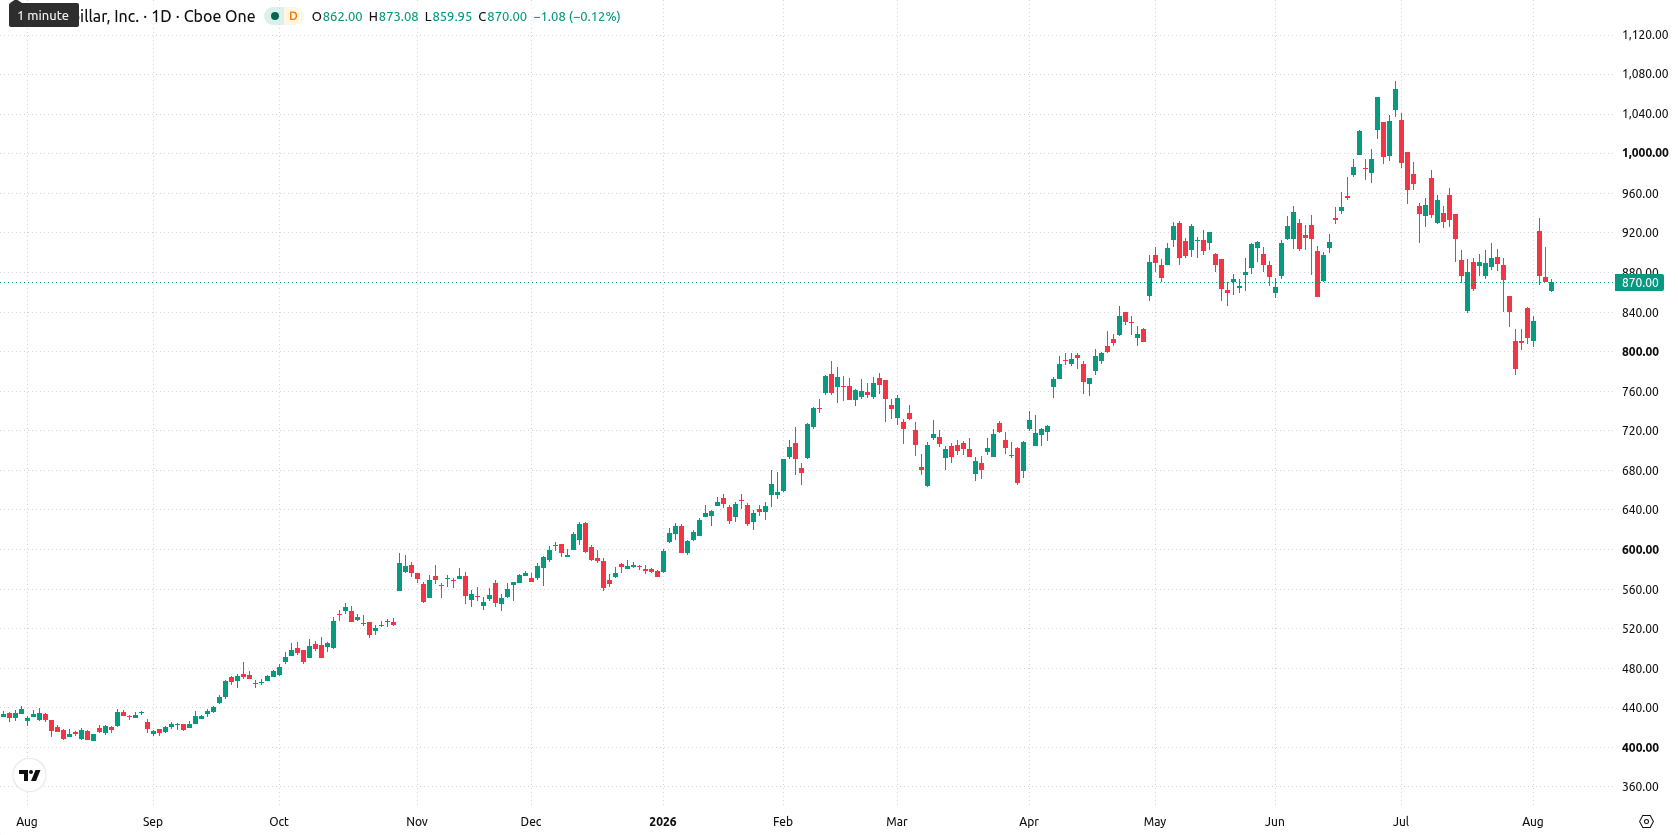
Mixed momentum and flat trend sustain indecision over the week
On the daily chart, Caterpillar remains in a flat trend structure following a sharp move higher without a sustained trend, as volatility over the past week reached 16.21%. Daily momentum signals are mixed: the MACD signals Strong Sell at -30.78, while Stochastic RSI sits in the overbought zone at 96.18. Immediate resistance is defined by the MA-20 at $877.73 and the Ichimoku Kijun at $924.73, with support at $804.57 from the weekly low. Together, these levels indicate a period of indecision, where the daily setup leans slightly bearish but is not confirmed by a strong trend.
Consolidation bias as breakout risks define next week’s range
For the next five trading days, the expected range is $789.5 to $927.91. The probability of a decrease stands at 53%, versus 47% for an increase. The base case anticipates consolidation between $804.57 and $877.73. A bullish breakout above $877.73 could expose the stock to further resistance near $924.73. Conversely, a move below $804.57 would open up downside risk towards the lower boundary of the expected range.
Earlier, analysts noted that Caterpillar was among the companies singled out by Michael Burry for short positioning as part of his broader market caution. With the latest technical setup showing indecision and a slight bearish lean, traders should closely monitor a potential break of either $877.73 on the upside or $804.57 on the downside for the next directional move.






Latest Caterpillar News




-
 Afghanistan
-
 Albania
-
 Algeria
-
 Angola
-
 Argentina
-
 Armenia
-
 Australia
-
 Austria
-
 Azerbaijan
-
 Bahamas
-
 Bahrain
-
 Bangladesh
-
 Belarus
-
 Belgium
-
 Bolivia
-
 Botswana
-
 Brazil
-
 Brunei
-
 Bulgaria
-
 Cambodia
-
 Cameroon
-
 Canada
-
 Chile
-
 China
-
 Colombia
-
 Congo
-
 Costa Rica
-
 Cote d'Ivoire
-
 Croatia
-
 Cuba
-
 Cyprus
-
 Czechia
-
 DR Congo
-
 Denmark
-
 Dominican Republic
-
 Ecuador
-
 Egypt
-
 El Salvador
-
 Estonia
-
 Eswatini
-
 Ethiopia
-
 Finland
-
 France
-
 Georgia
-
 Germany
-
 Ghana
-
 Greece
-
 Haiti
-
 Hong Kong
-
 Hungary
-
 India
-
 Indonesia
-
 Iran, Islamic republic
-
 Iraq
-
 Ireland
-
 Israel
-
 Italy
-
 Jamaica
-
 Japan
-
 Jordan
-
 Kazakhstan
-
 Kenya
-
 Korea
-
 Kuwait
-
 Kyrgyzstan
-
 Laos
-
 Latvia
-
 Lebanon
-
 Lesotho
-
 Libya
-
 Lithuania
-
 Luxembourg
-
 Madagascar
-
 Malaysia
-
 Malta
-
 Mauritius
-
 Mexico
-
 Moldova
-
 Mongolia
-
 Montenegro
-
 Morocco
-
 Mozambique
-
 Myanmar
-
 Namibia
-
 Nepal
-
 Netherlands
-
 New Zealand
-
 Nigeria
-
 North Macedonia
-
 Norway
-
 Oman
-
 Pakistan
-
 Palestine
-
 Panama
-
 Papua New Guinea
-
 Paraguay
-
 Peru
-
 Philippines
-
 Poland
-
 Portugal
-
 Puerto Rico
-
 Qatar
-
 Reunion
-
 Romania
-
 Rwanda
-
 Saudi Arabia
-
 Serbia
-
 Singapore
-
 Slovakia
-
 Slovenia
-
 Somalia
-
 South Africa
-
 Spain
-
 Sri Lanka
-
 Sweden
-
 Switzerland
-
 Syria
-
 Taiwan
-
 Tajikistan
-
 Tanzania
-
 Thailand
-
 Trinidad and Tobago
-
 Tunisia
-
 Turkey
-
 UAE
-
 Uganda
-
 Ukraine
-
 United Kingdom
-
United States
-
 Uruguay
-
 Uzbekistan
-
 Venezuela
-
 Vietnam
-
 Yemen
-
 Zambia
-
 Zimbabwe
- Forex
- Crypto












