


McKesson Corporation (MCK) dropped 3.64% after initial gains, even as strong fiscal first-quarter results and a raised guidance provided a fundamentally positive backdrop. The reversal is contradicted by continued bullish signals, with the price holding above all major moving averages and upward momentum dominating technicals.
 1012.58
1012.20
Highlights
- McKesson reported adjusted EPS of $9.93, beating estimates as revenue rose 8% to $105.4 billion on specialty drug strength.
- Management raised full-year guidance, increased the dividend by 15%, and completed $2.5 billion in buybacks and major capital transactions.
- Despite early intraday volatility and selling pressure, technical signals remain broadly bullish with a forecast price range of $811 to $923.57.
Robust earnings and capital moves outweighed by sustained selling pressure
McKesson Corporation reported adjusted earnings per share of $9.93 for its fiscal first quarter of 2027, exceeding analyst expectations. Quarterly revenue reached $105.4 billion, up 8%, led by growth in oncology and specialty drug distribution. The company raised full-year adjusted EPS and revenue guidance, implemented a 15% dividend increase, repurchased $2.5 billion in shares, and completed transactions including a $1.24 billion capital infusion and $3.2 billion long-term debt raise, though price action has remained under broader selling pressure.
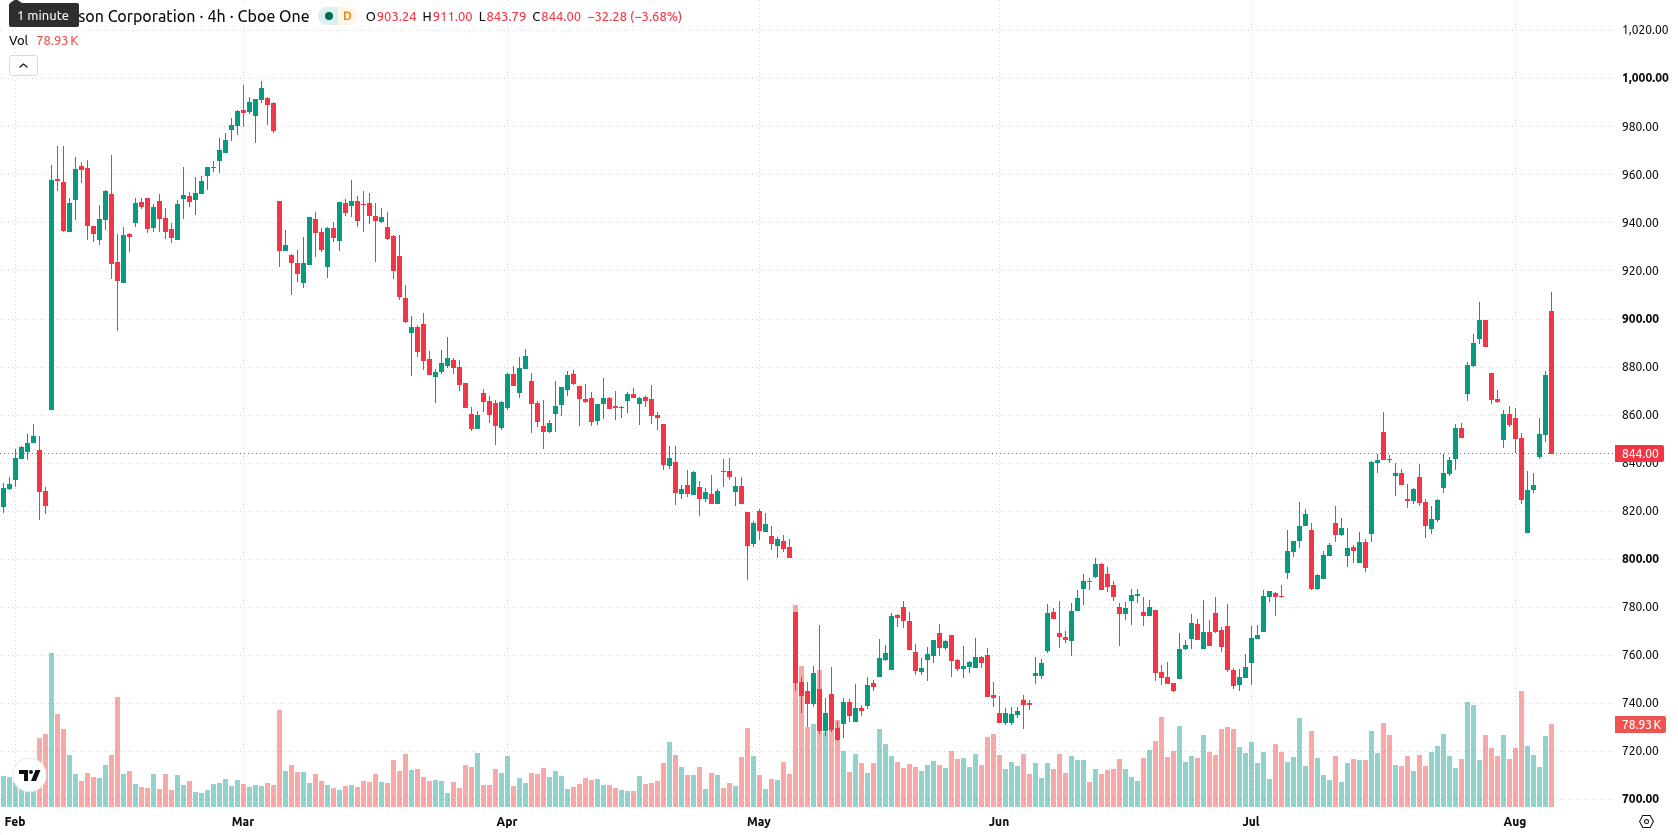
Upward momentum and positive breadth diverge from session lows
McKesson is trading above its 20-day ($836), 50-day ($795.05), and 200-day ($836.81) moving averages, indicating continued bullish structure for short-, medium-, and long-term trends. The Ichimoku Kijun at $825.79 acts as support, with the nearest ceiling at $879.48 (week high) and floor at $843.25 (today low); a bearish long-term tone is signaled by the MA-50 vs MA-200 alignment. Momentum readings are strong, as the Moving Average Convergence Divergence (MACD) signals “Strong Buy” and the Average Directional Index (ADX) is neutral, reflecting trend uncertainty. The Relative Strength Index (RSI), Stochastic RSI, and Commodity Channel Index (CCI) all point to continued upward momentum and are not yet overbought. Bull/Bear Power (BBP) is positive at 32.91, showing buyers dominate, but its overbought status warrants attention. The stock gapped higher at the open by approximately $28.75 (3.28%), but is now near its low for the session at $845.3, down $31.93 or 3.64%, with intraday volatility at 7.45%. Early strength is giving way to strong selling pressure after the open, diverging from prevailing bullish momentum signals.
Earlier, analysts noted that McKesson's price action was characterized by mixed technical signals and a tendency toward consolidation despite institutional accumulation. The current shift in intraday dynamics, with price weakness emerging after an initial gap higher, highlights the importance of monitoring the $843.25 floor as a key level for potential downside risk in the short term.





Latest McKesson Corporation News





-
 Afghanistan
-
 Albania
-
 Algeria
-
 Angola
-
 Argentina
-
 Armenia
-
 Australia
-
 Austria
-
 Azerbaijan
-
 Bahamas
-
 Bahrain
-
 Bangladesh
-
 Belarus
-
 Belgium
-
 Bolivia
-
 Botswana
-
 Brazil
-
 Brunei
-
 Bulgaria
-
 Cambodia
-
 Cameroon
-
 Canada
-
 Chile
-
 China
-
 Colombia
-
 Congo
-
 Costa Rica
-
 Cote d'Ivoire
-
 Croatia
-
 Cuba
-
 Cyprus
-
 Czechia
-
 DR Congo
-
 Denmark
-
 Dominican Republic
-
 Ecuador
-
 Egypt
-
 El Salvador
-
 Estonia
-
 Eswatini
-
 Ethiopia
-
 Finland
-
 France
-
 Georgia
-
 Germany
-
 Ghana
-
 Greece
-
 Haiti
-
 Hong Kong
-
 Hungary
-
 India
-
 Indonesia
-
 Iran, Islamic republic
-
 Iraq
-
 Ireland
-
 Israel
-
 Italy
-
 Jamaica
-
 Japan
-
 Jordan
-
 Kazakhstan
-
 Kenya
-
 Korea
-
 Kuwait
-
 Kyrgyzstan
-
 Laos
-
 Latvia
-
 Lebanon
-
 Lesotho
-
 Libya
-
 Lithuania
-
 Luxembourg
-
 Madagascar
-
 Malaysia
-
 Malta
-
 Mauritius
-
 Mexico
-
 Moldova
-
 Mongolia
-
 Montenegro
-
 Morocco
-
 Mozambique
-
 Myanmar
-
 Namibia
-
 Nepal
-
 Netherlands
-
 New Zealand
-
 Nigeria
-
 North Macedonia
-
 Norway
-
 Oman
-
 Pakistan
-
 Palestine
-
 Panama
-
 Papua New Guinea
-
 Paraguay
-
 Peru
-
 Philippines
-
 Poland
-
 Portugal
-
 Puerto Rico
-
 Qatar
-
 Reunion
-
 Romania
-
 Rwanda
-
 Saudi Arabia
-
 Serbia
-
 Singapore
-
 Slovakia
-
 Slovenia
-
 Somalia
-
 South Africa
-
 Spain
-
 Sri Lanka
-
 Sweden
-
 Switzerland
-
 Syria
-
 Taiwan
-
 Tajikistan
-
 Tanzania
-
 Thailand
-
 Trinidad and Tobago
-
 Tunisia
-
 Turkey
-
 UAE
-
 Uganda
-
 Ukraine
-
 United Kingdom
-
United States
-
 Uruguay
-
 Uzbekistan
-
 Venezuela
-
 Vietnam
-
 Yemen
-
 Zambia
-
 Zimbabwe
- Forex
- Crypto












