

Uber shares approach critical resistance at $78.12: weekly analysis

Shares of Uber Technologies, Inc. (UBER) are trading near $73, rallying more than 5% over the past week as the advance runs into signs of overbought conditions. The daily chart reveals conflicting momentum signals, highlighting growing tension between recent gains and technical caution. Traders now look to see if this rally has staying power or if consolidation is ahead.
 67.47
67.47
Highlights
- Shares of Uber closed at $73.46, showing strong short-term gains but remain in a bearish long-term structure.
- Momentum signals are mixed, with price nearing overbought conditions and suggesting increased vulnerability to a near-term pullback.
- The expected five-day range is $68.85 to $75.94, with 70% probability of decline and key support at $72.29.
Earnings beat lifts sentiment, but tempered Q3 outlook drives caution
Uber reported Q2 2026 earnings with revenue at $14.2 billion and gross bookings of $58 billion, according to CNBC, as strong non-GAAP earnings per share and record free cash flow delivered robust headline results. However, shares faced pressure after management's Q3 outlook for adjusted earnings and bookings fell short of analyst expectations, fueling caution for the week ahead. Uber also announced a $14.8 billion planned acquisition of Delivery Hero and a $550 million buyout of Blacklane, while committing over $10 billion to expand its autonomous vehicle business and reaffirming its partnership with Waymo.
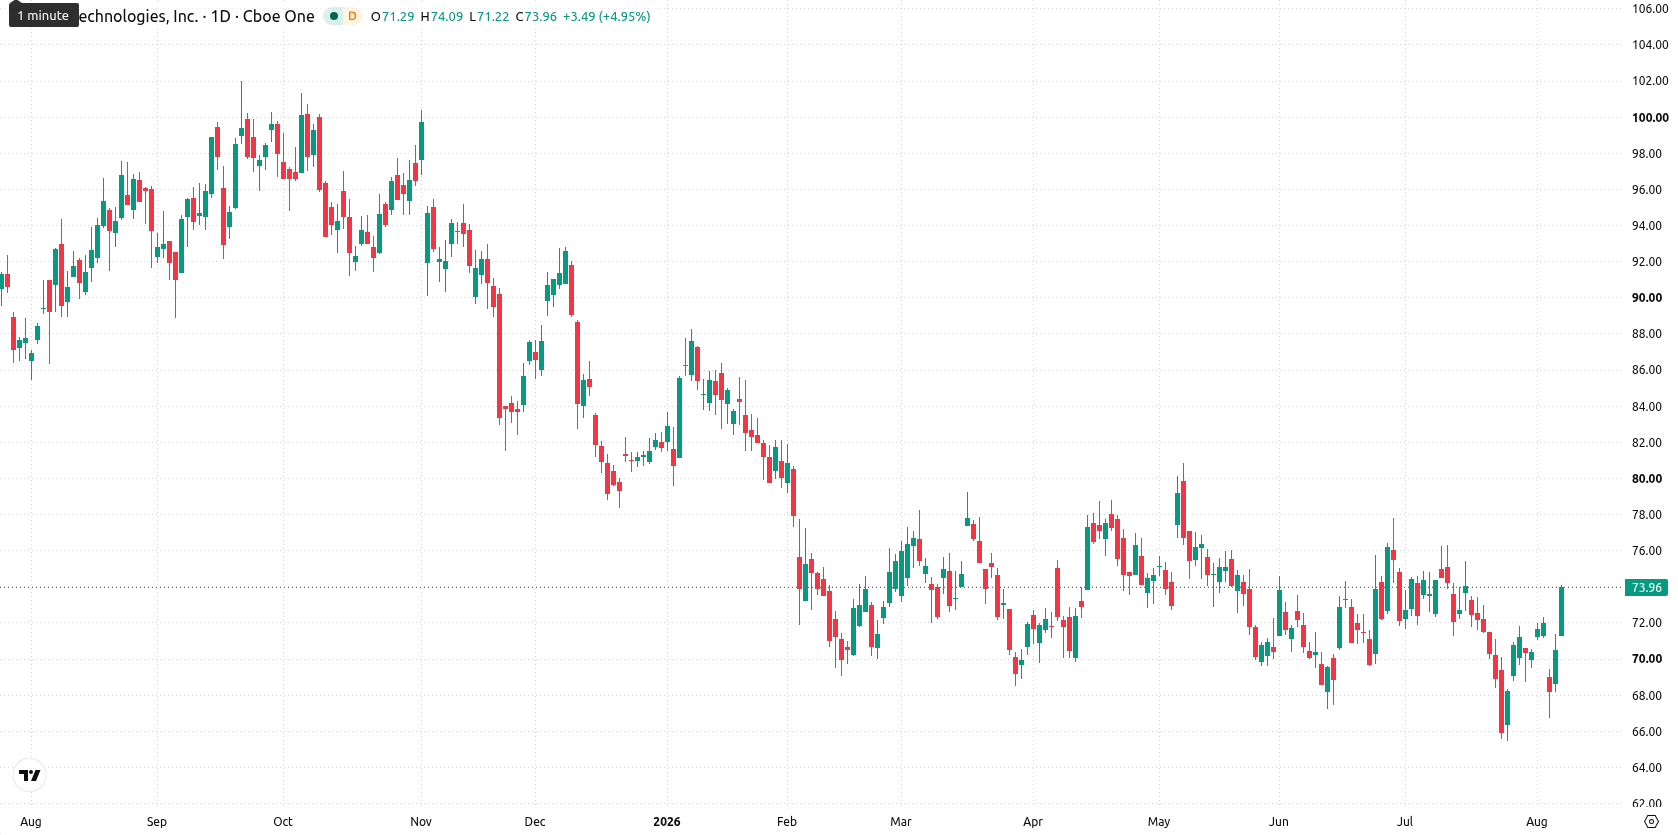
Momentum mixed over the week as technical signals diverge
On the daily chart, price action shows a sharp move higher without a sustained trend, with volatility over the past week reaching 8.32%. Despite the recent strength, the MACD signals "Strong Sell" with a reading of -0.78, and RSI stays neutral at 48.14, while Stochastic RSI points to an overbought condition at 81.16—highlighting a divergence in momentum signals. Support at $72.29 and the Ichimoku Kijun at $70.85 could provide stabilization, with the MA-200 at $78.12 as the next key resistance. This mix of signals suggests recent gains may be vulnerable to a near-term pullback.
Consolidation bias for next week amid breakout risk on key levels
For the next five trading days, the expected range is $68.85 to $75.94, with a 30% probability of an increase and a 70% probability of a decrease. The base case is a consolidation between support at $72.29 and resistance at $78.12. A break above $78.12 opens further upside, while a move below $72.29 or the Kijun support at $70.85 would point toward deeper weakness within the forecast range.
In a recent review, analysts highlighted Uber's persistent bearish technical structure following guidance disappointment and sustained downside pressure. The latest developments introduce heightened volatility and mixed momentum signals, making the $70.85 Kijun level a critical reference point for near-term direction as traders weigh the durability of the recent rally.









-
 Afghanistan
-
 Albania
-
 Algeria
-
 Angola
-
 Argentina
-
 Armenia
-
 Australia
-
 Austria
-
 Azerbaijan
-
 Bahamas
-
 Bahrain
-
 Bangladesh
-
 Belarus
-
 Belgium
-
 Bolivia
-
 Botswana
-
 Brazil
-
 Brunei
-
 Bulgaria
-
 Cambodia
-
 Cameroon
-
 Canada
-
 Chile
-
 China
-
 Colombia
-
 Congo
-
 Costa Rica
-
 Cote d'Ivoire
-
 Croatia
-
 Cuba
-
 Cyprus
-
 Czechia
-
 DR Congo
-
 Denmark
-
 Dominican Republic
-
 Ecuador
-
 Egypt
-
 El Salvador
-
 Estonia
-
 Eswatini
-
 Ethiopia
-
 Finland
-
 France
-
 Georgia
-
 Germany
-
 Ghana
-
 Greece
-
 Haiti
-
 Hong Kong
-
 Hungary
-
 India
-
 Indonesia
-
 Iran, Islamic republic
-
 Iraq
-
 Ireland
-
 Israel
-
 Italy
-
 Jamaica
-
 Japan
-
 Jordan
-
 Kazakhstan
-
 Kenya
-
 Korea
-
 Kuwait
-
 Kyrgyzstan
-
 Laos
-
 Latvia
-
 Lebanon
-
 Lesotho
-
 Libya
-
 Lithuania
-
 Luxembourg
-
 Madagascar
-
 Malaysia
-
 Malta
-
 Mauritius
-
 Mexico
-
 Moldova
-
 Mongolia
-
 Montenegro
-
 Morocco
-
 Mozambique
-
 Myanmar
-
 Namibia
-
 Nepal
-
 Netherlands
-
 New Zealand
-
 Nigeria
-
 North Macedonia
-
 Norway
-
 Oman
-
 Pakistan
-
 Palestine
-
 Panama
-
 Papua New Guinea
-
 Paraguay
-
 Peru
-
 Philippines
-
 Poland
-
 Portugal
-
 Puerto Rico
-
 Qatar
-
 Reunion
-
 Romania
-
 Rwanda
-
 Saudi Arabia
-
 Serbia
-
 Singapore
-
 Slovakia
-
 Slovenia
-
 Somalia
-
 South Africa
-
 Spain
-
 Sri Lanka
-
 Sweden
-
 Switzerland
-
 Syria
-
 Taiwan
-
 Tajikistan
-
 Tanzania
-
 Thailand
-
 Trinidad and Tobago
-
 Tunisia
-
 Turkey
-
 UAE
-
 Uganda
-
 Ukraine
-
 United Kingdom
-
United States
-
 Uruguay
-
 Uzbekistan
-
 Venezuela
-
 Vietnam
-
 Yemen
-
 Zambia
-
 Zimbabwe
- Forex
- Crypto












