


Nano Dimension Ltd (NNDM) advanced 3.5% as bullish technical momentum and early-session buying pressure drove the stock higher. The move looks limited, with the price still capped below its 200-day moving average at $1.68 and overbought signals emerging.
 1.28
1.38
Highlights
- Nano Dimension stock shows short-term bullish momentum trading above 20-day and 50-day averages, but stays below the 200-day average signaling longer-term weakness.
- Momentum indicators show mixed signals with bullish MACD and intraday buyer control, while overbought conditions warn of a possible pause or consolidation.
- Shares are expected to range between $1.56 and $1.69 in the next five days, with a 73% probability of further upward movement if resistance at $1.68 is surpassed.
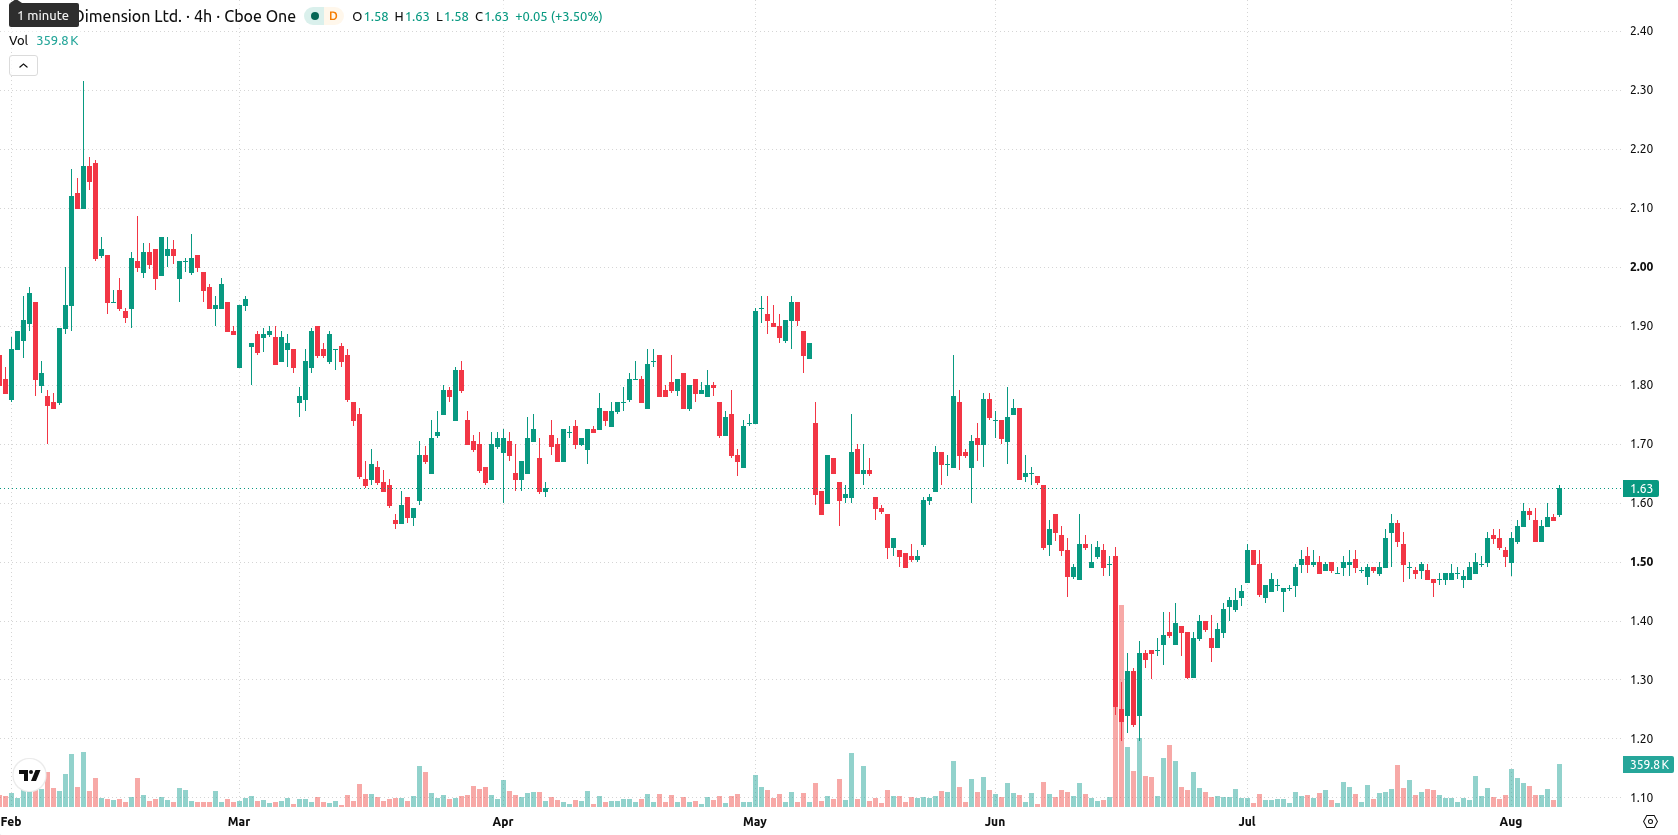
Mixed momentum as short-term gains confront resistance and overbought signs
Nano Dimension is trading above both its 20-day and 50-day moving averages ($1.51 and $1.47 respectively), indicating short- to medium-term bullish momentum, but remains below its 200-day moving average at $1.68, suggesting longer-term weakness. The price is currently supported by the Ichimoku Kijun ($1.51) with a near-term floor at $1.60 and faces resistance at the $1.68 near-term ceiling. Momentum indicators paint a mixed picture. The Moving Average Convergence Divergence (MACD) signals bullish momentum, but the Average Directional Index (ADX) indicates a weak trend. The Relative Strength Index (RSI) at 55.69 suggests modest bullishness, but both the Stochastic RSI (85.48) and Commodity Channel Index (CCI) at 147.29 are flagging overbought conditions. Bull/Bear Power (BBP) at 0.06 shows buyers have control intraday, but the overbought readings reinforce caution. The Awesome Oscillator (AO) is also supportive of the uptrend. The stock is trading at $1.63 after an upside gap of approximately $0.03 (1.91%), near the daily high, with intraday volatility at 3.82%. Early session strength aligns with momentum buyers, but overbought signals suggest the move could pause or consolidate.
Earlier, analysts noted that Nano Dimension was in a mixed technical holding pattern, with sideways action expected absent a decisive breakout or breakdown. The current article reinforces this outlook, and traders should watch for movement above $1.68 or below $1.60 as the next catalyst for directional momentum.






Latest Nano Dimension News





-
 Afghanistan
-
 Albania
-
 Algeria
-
 Angola
-
 Argentina
-
 Armenia
-
 Australia
-
 Austria
-
 Azerbaijan
-
 Bahamas
-
 Bahrain
-
 Bangladesh
-
 Belarus
-
 Belgium
-
 Bolivia
-
 Botswana
-
 Brazil
-
 Brunei
-
 Bulgaria
-
 Cambodia
-
 Cameroon
-
 Canada
-
 Chile
-
 China
-
 Colombia
-
 Congo
-
 Costa Rica
-
 Cote d'Ivoire
-
 Croatia
-
 Cuba
-
 Cyprus
-
 Czechia
-
 DR Congo
-
 Denmark
-
 Dominican Republic
-
 Ecuador
-
 Egypt
-
 El Salvador
-
 Estonia
-
 Eswatini
-
 Ethiopia
-
 Finland
-
 France
-
 Georgia
-
 Germany
-
 Ghana
-
 Greece
-
 Haiti
-
 Hong Kong
-
 Hungary
-
 India
-
 Indonesia
-
 Iran, Islamic republic
-
 Iraq
-
 Ireland
-
 Israel
-
 Italy
-
 Jamaica
-
 Japan
-
 Jordan
-
 Kazakhstan
-
 Kenya
-
 Korea
-
 Kuwait
-
 Kyrgyzstan
-
 Laos
-
 Latvia
-
 Lebanon
-
 Lesotho
-
 Libya
-
 Lithuania
-
 Luxembourg
-
 Madagascar
-
 Malaysia
-
 Malta
-
 Mauritius
-
 Mexico
-
 Moldova
-
 Mongolia
-
 Montenegro
-
 Morocco
-
 Mozambique
-
 Myanmar
-
 Namibia
-
 Nepal
-
 Netherlands
-
 New Zealand
-
 Nigeria
-
 North Macedonia
-
 Norway
-
 Oman
-
 Pakistan
-
 Palestine
-
 Panama
-
 Papua New Guinea
-
 Paraguay
-
 Peru
-
 Philippines
-
 Poland
-
 Portugal
-
 Puerto Rico
-
 Qatar
-
 Reunion
-
 Romania
-
 Rwanda
-
 Saudi Arabia
-
 Serbia
-
 Singapore
-
 Slovakia
-
 Slovenia
-
 Somalia
-
 South Africa
-
 Spain
-
 Sri Lanka
-
 Sweden
-
 Switzerland
-
 Syria
-
 Taiwan
-
 Tajikistan
-
 Tanzania
-
 Thailand
-
 Trinidad and Tobago
-
 Tunisia
-
 Turkey
-
 UAE
-
 Uganda
-
 Ukraine
-
 United Kingdom
-
United States
-
 Uruguay
-
 Uzbekistan
-
 Venezuela
-
 Vietnam
-
 Yemen
-
 Zambia
-
 Zimbabwe
- Forex
- Crypto












