

Costco shares remain pinned near support amid flat trend and low volatility: weekly analysis

Shares of Costco Wholesale Corporation (COST) are trading near $944, with chart signals mixed as buyers failed to sustain momentum above resistance. The market remains trapped between tight technical levels, and signals suggest neither bulls nor bears have seized control heading into the new week.
 1021.31
Highlights
- Shares of Costco are pinned at support near $942.17, showing a flat trend within a narrow trading range.
- The stock trades below key long-term moving averages, indicating a bearish structural bias and weak momentum.
- For the coming week, the expected range is $929.68 to $957.33 with a higher likelihood of downside movement unless price breaks above $947.62.
Institutional repositioning and steady sales growth temper post-earnings volatility
Costco reported net sales of $23.12 billion for the four weeks ending August 2, 2026, reflecting a 10.7% increase year over year, according to Simply Wall St. Fiscal 2025 results compiled by ad-hoc-news.de highlighted sales of $269.9 billion and net income of $8.10 billion, showcasing consistent revenue growth. GuruFocus noted a slight decline in the stock following the July report, and MarketBeat indicated new institutional activity with Sarasin & Partners LLP expanding its COST position and Canandaigua National Bank & Trust Co. acquiring shares, while First National Bank of Mount Dora Trust Investment Services trimmed its holdings.
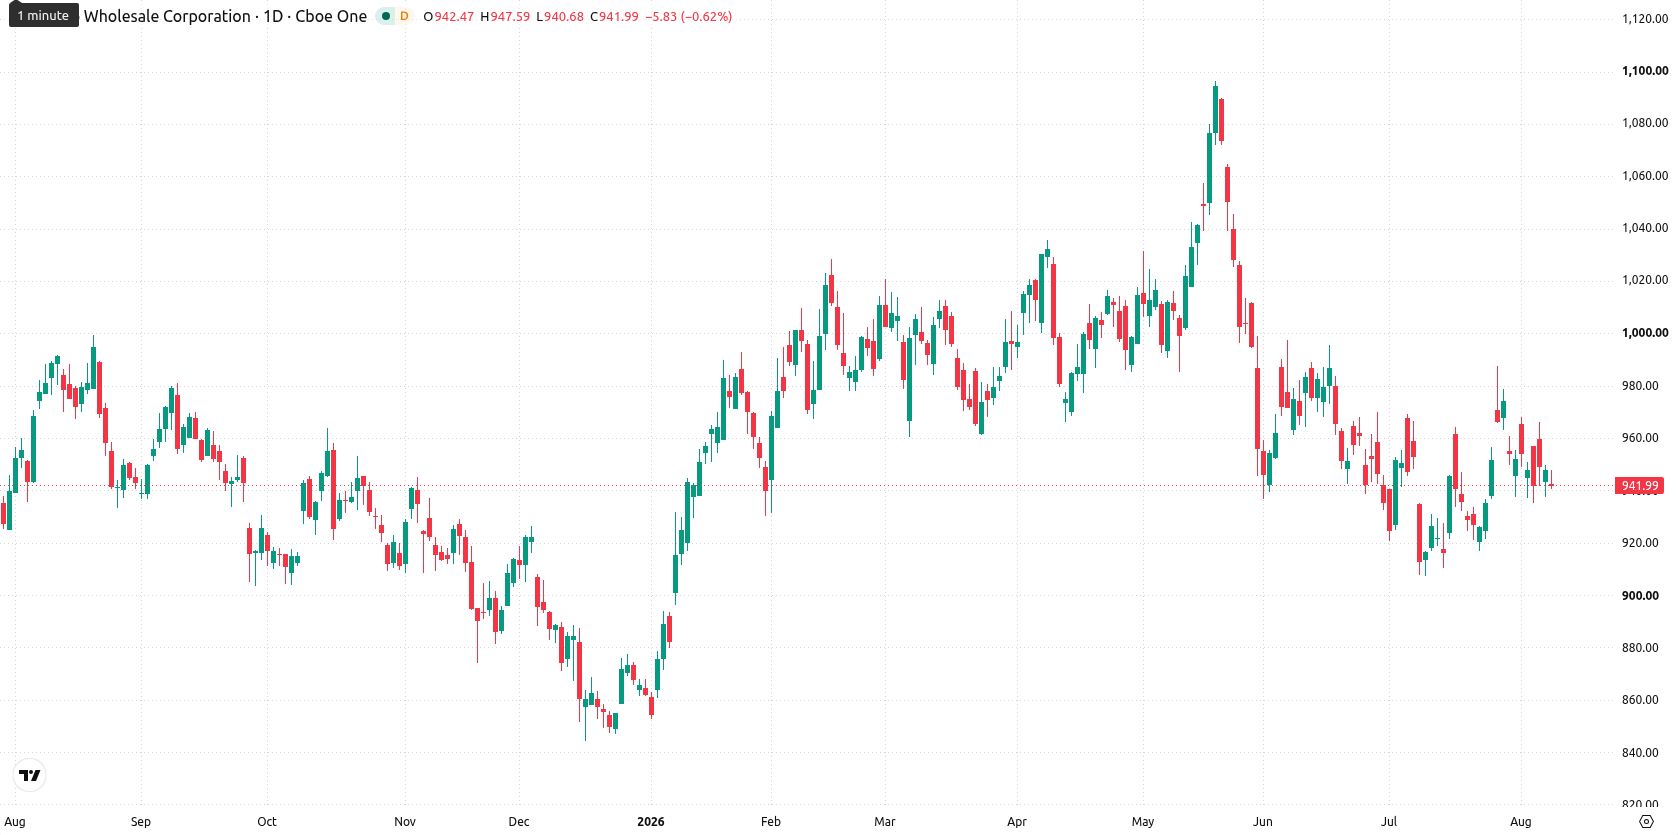
Flat trend and overbought signals define this week’s technical setup
On the daily chart, the broader setup is defined by a flat trend and a contained move within a narrow range, with weekly volatility at 3.31%. RSI at 49.98 remains neutral and Bull/Bear Power suggests buyer dominance has tipped into overbought territory, but the overall momentum remains mixed. Support sits at $942.17, right where the price is pinned, while resistance is in play at $947.62, marked by the Ichimoku Kijun. Short-term action is stuck between these reference levels, with a weak trend and no clear momentum push.
Downside risk rises as consolidation expected in coming week
For the coming trading week, the expected range is $929.68 to $957.33, with a very low probability of an increase and a very high probability of a decrease. The base case is consolidation between support at $942.17 and resistance at $947.62. Bullish momentum may develop on a sustained move above $947.62, while a break below support at $942.17 could open up downside risks toward the lower end of the expected range.
Earlier, analysts noted that Costco shares were consolidating as technical indicators signaled a standoff between bullish and bearish forces amid mixed capital return and sustainability developments. The current analysis confirms this neutral momentum, highlighting $942.17 as the key support level to watch, with a sustained break likely to set the next directional move.











-
 Afghanistan
-
 Albania
-
 Algeria
-
 Angola
-
 Argentina
-
 Armenia
-
 Australia
-
 Austria
-
 Azerbaijan
-
 Bahamas
-
 Bahrain
-
 Bangladesh
-
 Belarus
-
 Belgium
-
 Bolivia
-
 Botswana
-
 Brazil
-
 Brunei
-
 Bulgaria
-
 Cambodia
-
 Cameroon
-
 Canada
-
 Chile
-
 China
-
 Colombia
-
 Congo
-
 Costa Rica
-
 Cote d'Ivoire
-
 Croatia
-
 Cuba
-
 Cyprus
-
 Czechia
-
 DR Congo
-
 Denmark
-
 Dominican Republic
-
 Ecuador
-
 Egypt
-
 El Salvador
-
 Estonia
-
 Eswatini
-
 Ethiopia
-
 Finland
-
 France
-
 Georgia
-
 Germany
-
 Ghana
-
 Greece
-
 Haiti
-
 Hong Kong
-
 Hungary
-
 India
-
 Indonesia
-
 Iran, Islamic republic
-
 Iraq
-
 Ireland
-
 Israel
-
 Italy
-
 Jamaica
-
 Japan
-
 Jordan
-
 Kazakhstan
-
 Kenya
-
 Korea
-
 Kuwait
-
 Kyrgyzstan
-
 Laos
-
 Latvia
-
 Lebanon
-
 Lesotho
-
 Libya
-
 Lithuania
-
 Luxembourg
-
 Madagascar
-
 Malaysia
-
 Malta
-
 Mauritius
-
 Mexico
-
 Moldova
-
 Mongolia
-
 Montenegro
-
 Morocco
-
 Mozambique
-
 Myanmar
-
 Namibia
-
 Nepal
-
 Netherlands
-
 New Zealand
-
 Nigeria
-
 North Macedonia
-
 Norway
-
 Oman
-
 Pakistan
-
 Palestine
-
 Panama
-
 Papua New Guinea
-
 Paraguay
-
 Peru
-
 Philippines
-
 Poland
-
 Portugal
-
 Puerto Rico
-
 Qatar
-
 Reunion
-
 Romania
-
 Rwanda
-
 Saudi Arabia
-
 Serbia
-
 Singapore
-
 Slovakia
-
 Slovenia
-
 Somalia
-
 South Africa
-
 Spain
-
 Sri Lanka
-
 Sweden
-
 Switzerland
-
 Syria
-
 Taiwan
-
 Tajikistan
-
 Tanzania
-
 Thailand
-
 Trinidad and Tobago
-
 Tunisia
-
 Turkey
-
 UAE
-
 Uganda
-
 Ukraine
-
 United Kingdom
-
United States
-
 Uruguay
-
 Uzbekistan
-
 Venezuela
-
 Vietnam
-
 Yemen
-
 Zambia
-
 Zimbabwe
- Forex
- Crypto












