


Eli Lilly and Company (LLY) surged 3.67% after posting strong second-quarter results and raising its full-year outlook. The advance is supported by a bullish technical structure, with the stock trading above all major moving averages and holding near its recent highs.
 1434.54
1437.00
Highlights
- Eli Lilly reported a 48% year-over-year revenue surge to $23.0 billion, raising its full-year sales and profit forecast.
- Second-quarter charges of $703 million related to Kelonia and Centessa increased the company's effective tax rate to 23.3%.
- Eli Lilly stock remains bullish, trading near session highs with an expected five-day range of $1,167 to $1,288 and overbought conditions cautioning for possible consolidation.
Guidance raised despite impairment charges impacting tax rate
Eli Lilly reported second-quarter revenue of $23.0 billion, marking a 48% increase year over year and prompting the company to raise its full-year sales and profit guidance. The results included $703 million in asset impairment and restructuring charges linked to the Kelonia and Centessa deals, leading to the effective tax rate rising from 16.5% to 23.3%. Eli Lilly also received attention in healthcare sector updates and improved its ranking among blue-chip stocks.
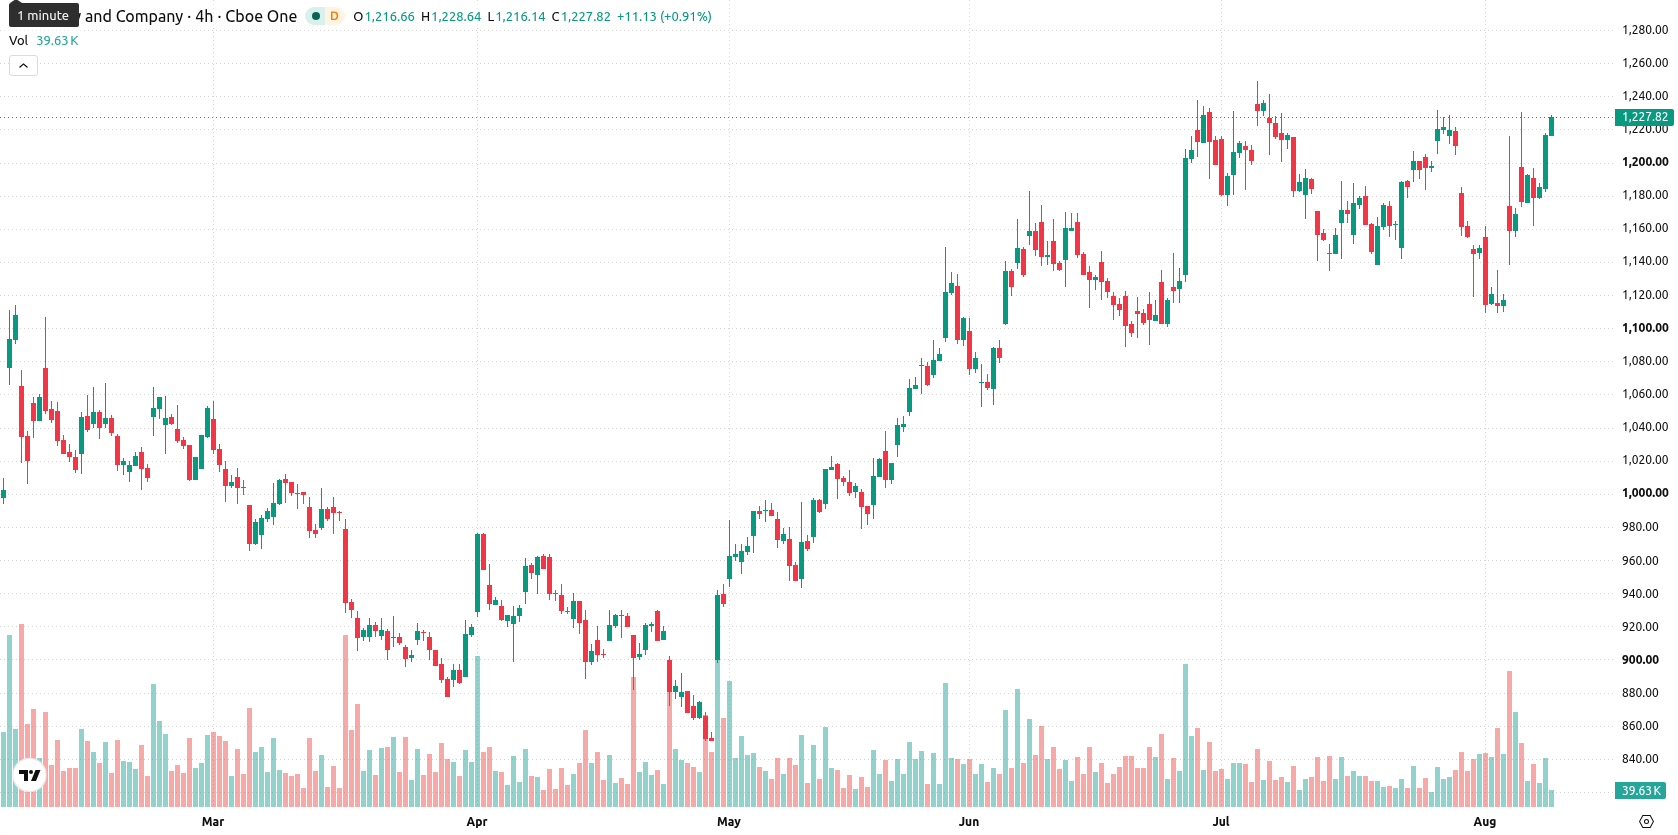
Uptrend confirmed as multiple indicators flag strong but overbought setup
LLY is trading above its 20-day, 50-day, and 200-day moving averages ($1,170, $1,157, and $1,033), indicating a bullish short-term setup with strong medium- and long-term trend support. The stock remains close to its recent high, with immediate resistance at $1,230 (week high) and support at $1,227 (today high), both levels further validated by the Ichimoku Kijun at $1,179. Technical momentum is firm, as the MACD generates a strong buy forecast, while the ADX signals a neutral trend. The RSI also points to a buy signal, yet the Stochastic RSI and CCI remain neutral. Bull/Bear Power (BBP) signals strong buying dominance, but with an overbought warning present. The intraday tone stays strong, with volatility at 2.46% and upward momentum holding toward the session’s high, though some divergence exists between bullish momentum signals and neutral oscillator readings.
Earlier, analysts noted that Eli Lilly stock demonstrated sustained technical momentum following robust earnings and upward guidance revisions. The current analysis adds further confirmation, identifying a continued bullish setup with the next major catalyst likely to be a decisive move above or below the $1,230–$1,227 price cluster.






Latest Eli Lilly and Company News




-
 Afghanistan
-
 Albania
-
 Algeria
-
 Angola
-
 Argentina
-
 Armenia
-
 Australia
-
 Austria
-
 Azerbaijan
-
 Bahamas
-
 Bahrain
-
 Bangladesh
-
 Belarus
-
 Belgium
-
 Bolivia
-
 Botswana
-
 Brazil
-
 Brunei
-
 Bulgaria
-
 Cambodia
-
 Cameroon
-
 Canada
-
 Chile
-
 China
-
 Colombia
-
 Congo
-
 Costa Rica
-
 Cote d'Ivoire
-
 Croatia
-
 Cuba
-
 Cyprus
-
 Czechia
-
 DR Congo
-
 Denmark
-
 Dominican Republic
-
 Ecuador
-
 Egypt
-
 El Salvador
-
 Estonia
-
 Eswatini
-
 Ethiopia
-
 Finland
-
 France
-
 Georgia
-
 Germany
-
 Ghana
-
 Greece
-
 Haiti
-
 Hong Kong
-
 Hungary
-
 India
-
 Indonesia
-
 Iran, Islamic republic
-
 Iraq
-
 Ireland
-
 Israel
-
 Italy
-
 Jamaica
-
 Japan
-
 Jordan
-
 Kazakhstan
-
 Kenya
-
 Korea
-
 Kuwait
-
 Kyrgyzstan
-
 Laos
-
 Latvia
-
 Lebanon
-
 Lesotho
-
 Libya
-
 Lithuania
-
 Luxembourg
-
 Madagascar
-
 Malaysia
-
 Malta
-
 Mauritius
-
 Mexico
-
 Moldova
-
 Mongolia
-
 Montenegro
-
 Morocco
-
 Mozambique
-
 Myanmar
-
 Namibia
-
 Nepal
-
 Netherlands
-
 New Zealand
-
 Nigeria
-
 North Macedonia
-
 Norway
-
 Oman
-
 Pakistan
-
 Palestine
-
 Panama
-
 Papua New Guinea
-
 Paraguay
-
 Peru
-
 Philippines
-
 Poland
-
 Portugal
-
 Puerto Rico
-
 Qatar
-
 Reunion
-
 Romania
-
 Rwanda
-
 Saudi Arabia
-
 Serbia
-
 Singapore
-
 Slovakia
-
 Slovenia
-
 Somalia
-
 South Africa
-
 Spain
-
 Sri Lanka
-
 Sweden
-
 Switzerland
-
 Syria
-
 Taiwan
-
 Tajikistan
-
 Tanzania
-
 Thailand
-
 Trinidad and Tobago
-
 Tunisia
-
 Turkey
-
 UAE
-
 Uganda
-
 Ukraine
-
 United Kingdom
-
United States
-
 Uruguay
-
 Uzbekistan
-
 Venezuela
-
 Vietnam
-
 Yemen
-
 Zambia
-
 Zimbabwe
- Forex
- Crypto












