

Johnson & Johnson stock weekly forecast: Momentum contained with MACD bullish and volatility steady

Shares of Johnson & Johnson (JNJ) are trading near $259 as the stock extends its recovery from recent lows but faces the risk of being overbought. Corporate momentum from recent earnings strength sets a constructive tone, while investors look for signs of further upside or possible consolidation heading into next week.
 257.55
264.13
257.55
264.13
Highlights
- Shares of Johnson & Johnson hold a bullish long-term technical structure, trading at $259.32 and maintaining levels above key moving averages.
- Price action remains flat, with shares consolidating narrowly between $256.84 support and $260.2 resistance as momentum indicators register neutral or overbought conditions.
- For the coming week, shares are projected to range between $251.98 and $262.73, with a high probability of upward movement if resistance breaks.
Upbeat quarterly results and guidance propel positive sentiment this week
Johnson & Johnson reported strong fiscal second-quarter 2026 results, with sales rising nearly 7% to $25.31 billion and adjusted EPS at $2.90, both exceeding analyst expectations, according to Yahoo Finance. The company also updated its 2026 guidance, projecting annual sales of $93.2 billion to $93.6 billion and adjusted EPS of $10.80 to $10.90. Recent filings revealed ongoing institutional activity and plans for participation at the 2026 Wells Fargo Healthcare Conference.
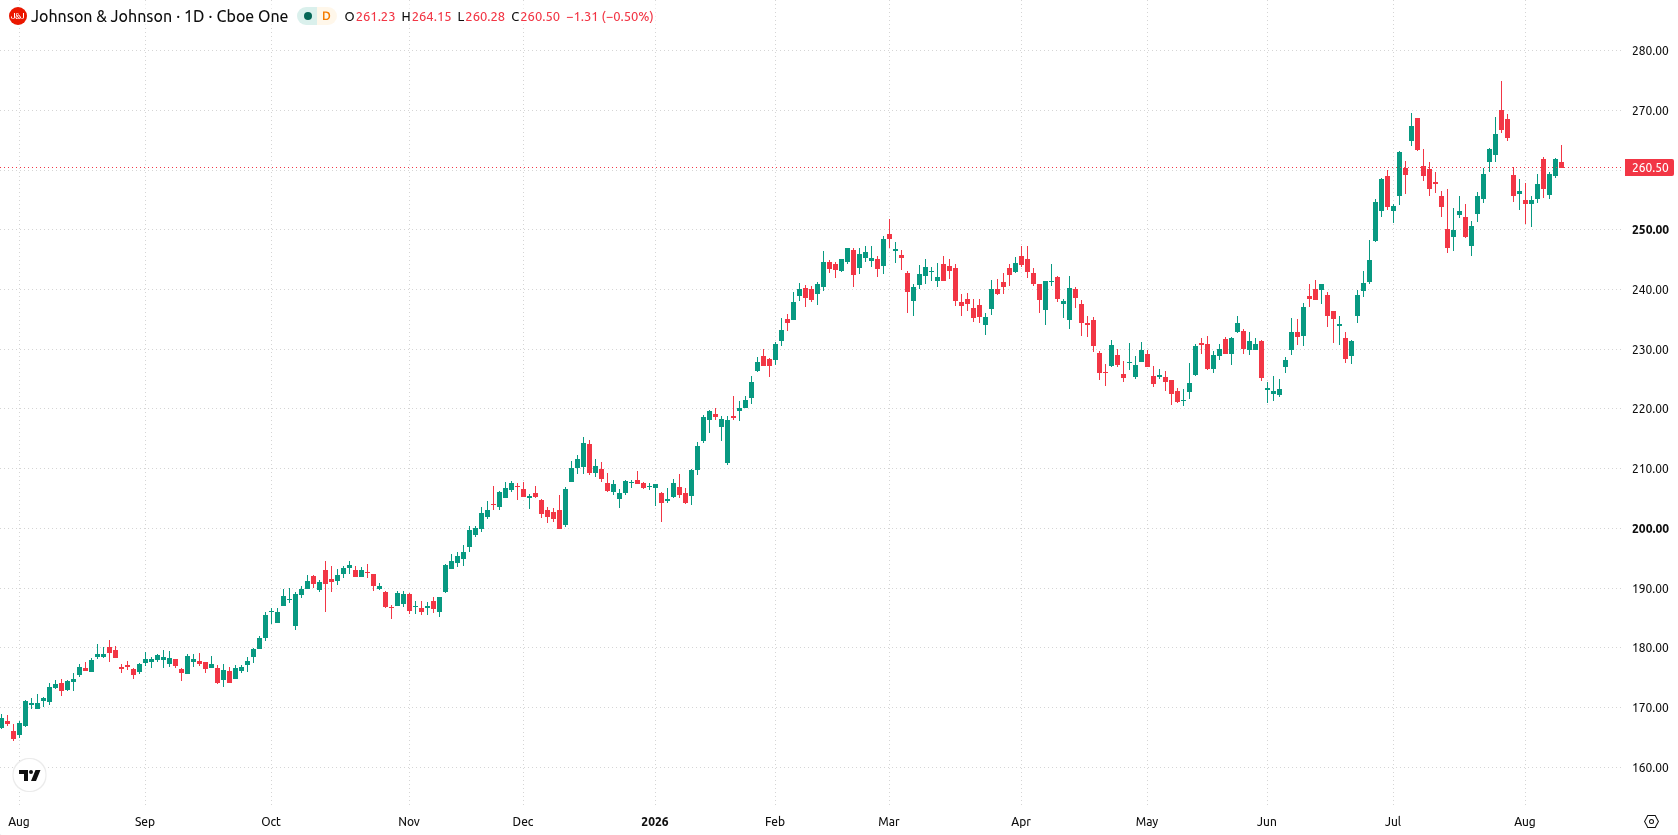
Bullish technical bias offset by overbought signals and flat weekly range
On the daily chart, Johnson & Johnson shares display a flat trend, with price action reflecting a contained move within a narrow range and volatility at 3% over the past week. MACD remains firmly bullish with a value of 2.8, while Bull/Bear Power signals an overbought condition. The nearest support is at $256.84, with immediate resistance and the Ichimoku Kijun level converging at $260.2, as the stock trades just under this resistance. This setup suggests consolidation just beneath resistance, with directional momentum held in check by neutral RSI and CCI readings.
Upside breakout risk as consolidation persists within defined weekly range
In the week ahead, Johnson & Johnson shares are expected to trade between $251.98 and $262.73. There is a very high probability of an increase and a very low probability of a decrease. The base case sees the stock consolidating between support at $256.84 and resistance at $260.2. A break above $260.2 could open the way toward the top end of the range, while a dip below $256.84 would bring the lower boundary around $251.98 into focus.
Earlier, analysts noted that strong GLP-1 sales and product innovation were key drivers in the healthcare sector's recent outperformance. The current technical outlook for Johnson & Johnson confirms the sector's resilience, with the $260.2 resistance remaining a pivotal breakout level to monitor in the near term.




Latest Johnson & Johnson News






-
 Afghanistan
-
 Albania
-
 Algeria
-
 Angola
-
 Argentina
-
 Armenia
-
 Australia
-
 Austria
-
 Azerbaijan
-
 Bahamas
-
 Bahrain
-
 Bangladesh
-
 Belarus
-
 Belgium
-
 Bolivia
-
 Botswana
-
 Brazil
-
 Brunei
-
 Bulgaria
-
 Cambodia
-
 Cameroon
-
 Canada
-
 Chile
Chile
-
 China
China
-
 Colombia
-
 Congo
Congo
-
 Costa Rica
-
 Cote d'Ivoire
-
 Croatia
-
 Cuba
Cuba
-
 Cyprus
-
 Czechia
-
 DR Congo
-
 Denmark
-
 Dominican Republic
-
 Ecuador
-
 Egypt
Egypt
-
 El Salvador
-
 Estonia
-
 Eswatini
-
 Ethiopia
-
 Finland
-
 France
-
 Georgia
-
 Germany
-
 Ghana
Ghana
-
 Greece
-
 Haiti
Haiti
-
 Hong Kong
-
 Hungary
-
 India
India
-
 Indonesia
-
 Iran, Islamic republic
-
 Iraq
Iraq
-
 Ireland
-
 Israel
-
 Italy
Italy
-
 Jamaica
-
 Japan
Japan
-
 Jordan
-
 Kazakhstan
-
 Kenya
Kenya
-
 Korea
Korea
-
 Kuwait
-
 Kyrgyzstan
-
 Laos
Laos
-
 Latvia
-
 Lebanon
-
 Lesotho
-
 Libya
Libya
-
 Lithuania
-
 Luxembourg
-
 Madagascar
-
 Malaysia
-
 Malta
Malta
-
 Mauritius
-
 Mexico
-
 Moldova
-
 Mongolia
-
 Montenegro
-
 Morocco
-
 Mozambique
-
 Myanmar
-
 Namibia
-
 Nepal
Nepal
-
 Netherlands
-
 New Zealand
-
 Nigeria
-
 North Macedonia
-
 Norway
-
 Oman
Oman
-
 Pakistan
-
 Palestine
-
 Panama
-
 Papua New Guinea
-
 Paraguay
-
 Peru
Peru
-
 Philippines
-
 Poland
-
 Portugal
-
 Puerto Rico
-
 Qatar
Qatar
-
 Reunion
-
 Romania
-
 Rwanda
-
 Saudi Arabia
-
 Serbia
-
 Singapore
-
 Slovakia
-
 Slovenia
-
 Somalia
-
 South Africa
-
 Spain
Spain
-
 Sri Lanka
-
 Sweden
-
 Switzerland
-
 Syria
Syria
-
 Taiwan
-
 Tajikistan
-
 Tanzania
-
 Thailand
-
 Trinidad and Tobago
-
 Tunisia
-
 Turkey
-
 UAE
UAE
-
 Uganda
-
 Ukraine
-
 United Kingdom
-
United States
-
 Uruguay
-
 Uzbekistan
-
 Venezuela
-
 Vietnam
-
 Yemen
Yemen
-
 Zambia
-
 Zimbabwe
- Forex
- Crypto












