

Berkshire Hathaway stock weekly forecast: Uptrend faces overbought signals amid strong Q2 earnings

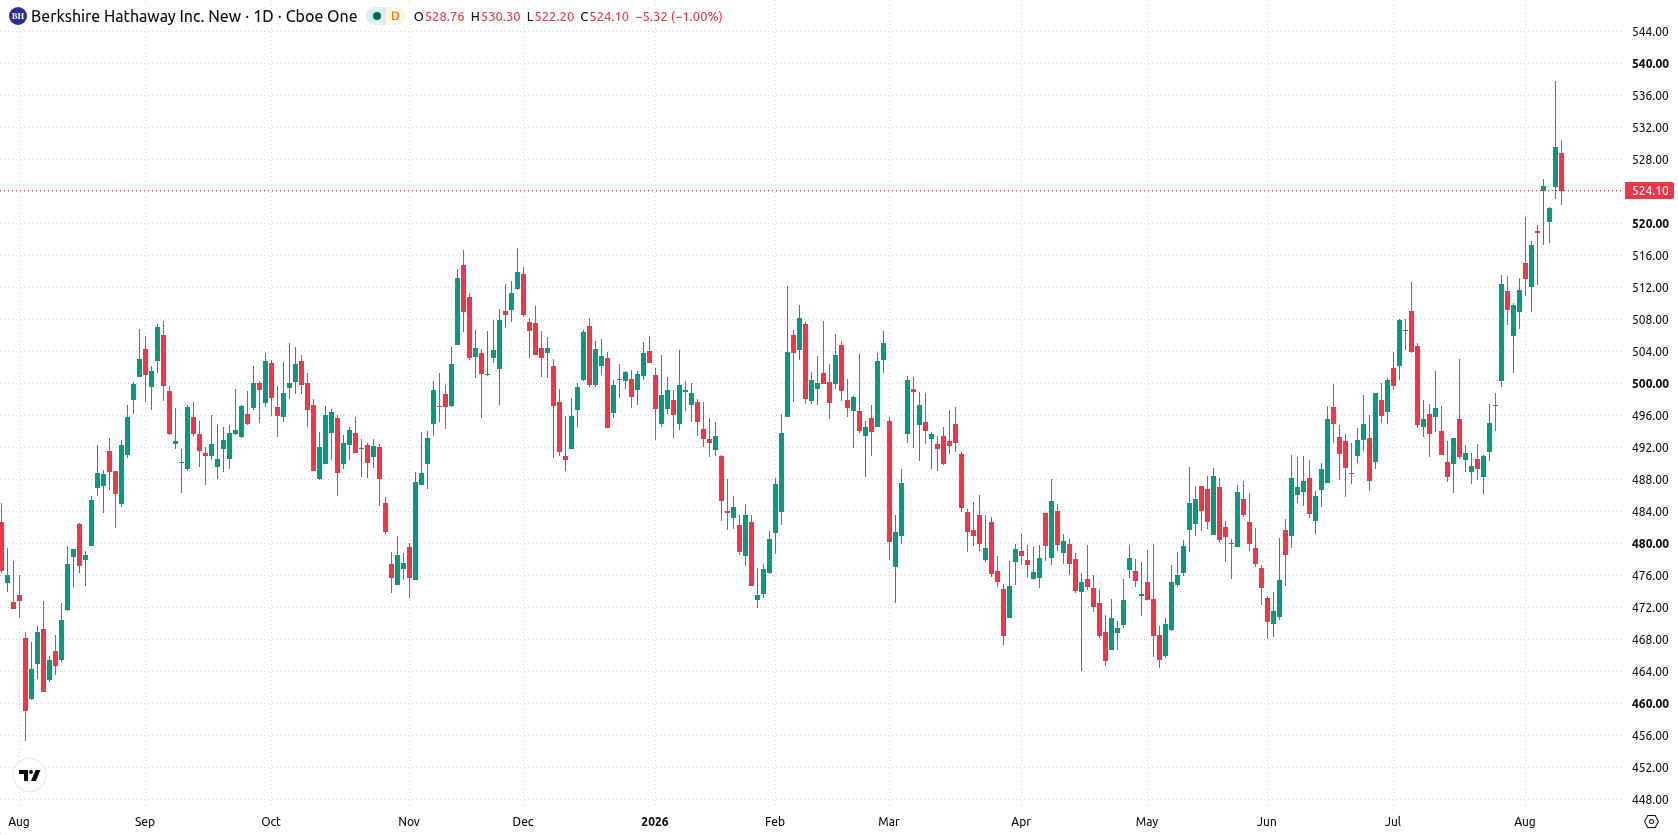
Shares of Berkshire Hathaway Inc. (BRK.B) are trading near $524 as the recent rally slows and technical signals point to overbought territory. The stock maintains a firm upward trend, but with the momentum now appearing stretched, traders are watching to see if bullish energy can persist into next week.
 578.32
559.58
Highlights
- Shares of Berkshire Hathaway rose $2.67 over the past week to $523.57, maintaining a strong upward trend.
- The stock remains well above key moving averages as multiple indicators register overbought conditions and heightened volatility.
- Trading is expected between $512.17 and $534.96 for the coming week, with resistance at $537.69 and strong support around $512.2.
Earnings surge and capital deployment drive sentiment over the week
Berkshire reported strong second quarter results under new CEO Greg Abel, with operating earnings up 16% to $12.98 billion, according to CNBC and Yahoo Finance. The company executed $4.5 billion in share buybacks in Q2 2026, its largest since 2021, and invested approximately $10 billion in Alphabet along with other significant equity purchases. Berkshire's cash holdings dropped to $365.5 billion by the end of June as capital was deployed into buybacks, investments, and the closing of acquisitions including OxyChem and Taylor Morrison.
Bullish momentum sustained as overbought signals intensify during the week
On the daily chart, the stock shows a sustained move higher with a firm trend, as momentum remains pointed up and volatility stands at 4.98% over the week. Several oscillators highlight overbought conditions—RSI is at 73.6 and CCI at 152.81—while MACD confirms the underlying trend strength. Immediate support is found at $512.2, which nearly aligns with the Ichimoku Kijun at $511.88, and the nearest resistance sits at $537.69. The overall setup signals that bullish momentum remains dominant, but overheating technicals suggest the advance is increasingly stretched in the short run.
Upside bias prevails if resistance is broken in the coming week
For the coming trading week, the expected range is $512.17 to $534.96. There is a very high probability of price increasing and a very low probability of a decrease. The base case sees the stock consolidating within this range above $512.17. A break above $537.69 would signal another leg higher, while a pullback below $512.2 could trigger deeper consolidation toward the lower end of the range.
Earlier, analysts noted that Berkshire Hathaway’s technical outlook was strengthening, supported by improved momentum and a more active approach to capital deployment. With current signals showing the uptrend is intact but near-term conditions are stretched, traders should monitor for a potential shift in momentum if support at $512.2 fails in the coming week.






Latest Berkshire Hathaway News





-
 Afghanistan
-
 Albania
-
 Algeria
-
 Angola
-
 Argentina
-
 Armenia
-
 Australia
-
 Austria
-
 Azerbaijan
-
 Bahamas
-
 Bahrain
-
 Bangladesh
-
 Belarus
-
 Belgium
-
 Bolivia
-
 Botswana
-
 Brazil
-
 Brunei
-
 Bulgaria
-
 Cambodia
-
 Cameroon
-
 Canada
-
 Chile
-
 China
-
 Colombia
-
 Congo
-
 Costa Rica
-
 Cote d'Ivoire
-
 Croatia
-
 Cuba
-
 Cyprus
-
 Czechia
-
 DR Congo
-
 Denmark
-
 Dominican Republic
-
 Ecuador
-
 Egypt
-
 El Salvador
-
 Estonia
-
 Eswatini
-
 Ethiopia
-
 Finland
-
 France
-
 Georgia
-
 Germany
-
 Ghana
-
 Greece
-
 Haiti
-
 Hong Kong
-
 Hungary
-
 India
-
 Indonesia
-
 Iran, Islamic republic
-
 Iraq
-
 Ireland
-
 Israel
-
 Italy
-
 Jamaica
-
 Japan
-
 Jordan
-
 Kazakhstan
-
 Kenya
-
 Korea
-
 Kuwait
-
 Kyrgyzstan
-
 Laos
-
 Latvia
-
 Lebanon
-
 Lesotho
-
 Libya
-
 Lithuania
-
 Luxembourg
-
 Madagascar
-
 Malaysia
-
 Malta
-
 Mauritius
-
 Mexico
-
 Moldova
-
 Mongolia
-
 Montenegro
-
 Morocco
-
 Mozambique
-
 Myanmar
-
 Namibia
-
 Nepal
-
 Netherlands
-
 New Zealand
-
 Nigeria
-
 North Macedonia
-
 Norway
-
 Oman
-
 Pakistan
-
 Palestine
-
 Panama
-
 Papua New Guinea
-
 Paraguay
-
 Peru
-
 Philippines
-
 Poland
-
 Portugal
-
 Puerto Rico
-
 Qatar
-
 Reunion
-
 Romania
-
 Rwanda
-
 Saudi Arabia
-
 Serbia
-
 Singapore
-
 Slovakia
-
 Slovenia
-
 Somalia
-
 South Africa
-
 Spain
-
 Sri Lanka
-
 Sweden
-
 Switzerland
-
 Syria
-
 Taiwan
-
 Tajikistan
-
 Tanzania
-
 Thailand
-
 Trinidad and Tobago
-
 Tunisia
-
 Turkey
-
 UAE
-
 Uganda
-
 Ukraine
-
 United Kingdom
-
United States
-
 Uruguay
-
 Uzbekistan
-
 Venezuela
-
 Vietnam
-
 Yemen
-
 Zambia
-
 Zimbabwe
- Forex
- Crypto












