

TELUS stock rally gains traction as buyer activity supports upward move

TELUS (T) stock is trading at C$13.52 after rising 1.2% today. The price remains below its key moving averages, reflecting ongoing downward pressure.
 13.80
13.80
Highlights
- TELUS announced a 55.2% reduction in its dividend, lowering shareholder income and causing negative market reaction.
- Management will address its strategic direction and restructuring progress in the third quarter earnings call scheduled for November.
- Shares of TELUS trade below key moving averages and face a 62% probability of downside within the C$13.11 to C$13.93 range in the next few days.
Dividend cut and policy overhaul reshape sentiment amid strategy update wait
TELUS announced a 55.2% cut to its dividend in its July 31, 2026 second quarter earnings report, a move that, according to Theglobeandmail, significantly reduced income for current shareholders and prompted negative market sentiment. While this reduction represents a major shift in payout policy and adjusts investor expectations for yield, management aims to clarify its strategy and restructuring progress during the third quarter earnings call in November, as reported by Finance Yahoo. In a separate operational step, TELUS will institute a 60-day lock on newly financed smartphones in October to curtail fraud and theft risks, according to Iphoneincanada. As the market continues to absorb these recent corporate actions, sentiment is shaped by both payout changes and expectations for upcoming strategic updates.
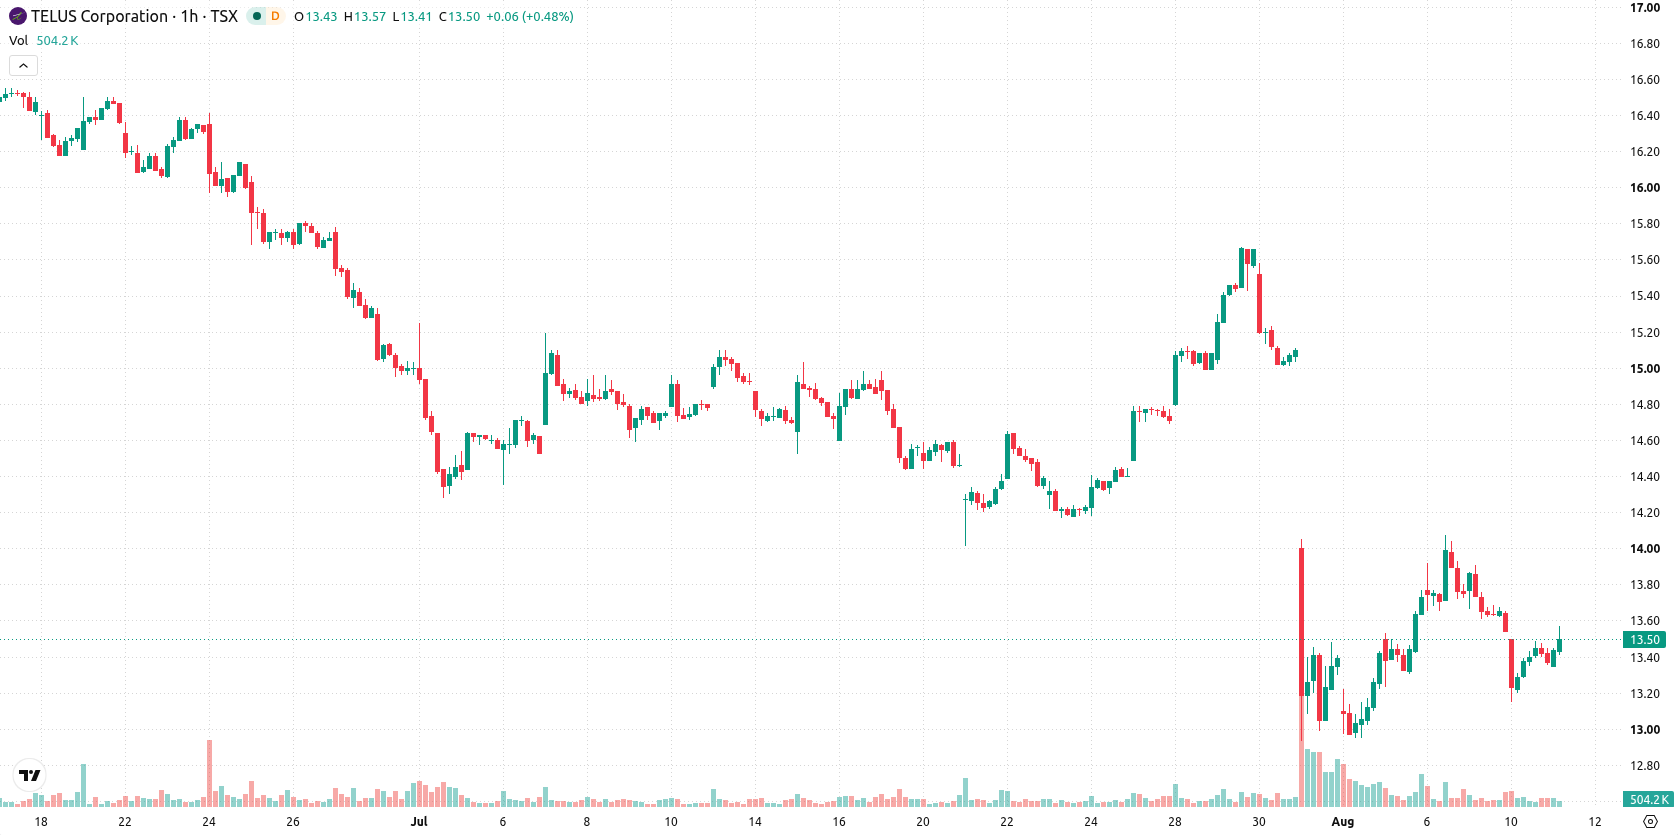
Mixed technical momentum as share price faces key resistance
On the technical front, T is trading below the MA-20 at C$13.58 and MA-50 at C$13.65 on the hourly chart, and remains well under the long-term MA-200 at C$17.60 on the daily. The Ichimoku Kijun level at C$13.61 forms immediate resistance. Momentum signals are mixed: MACD and ADX indicate a strong sell, while RSI stands neutral at 47.88 and Stoch RSI is overbought. CCI is neutral, Bull/Bear Power signals strong buy pointing to notable intraday buyer strength, and AO remains neutral, highlighting divergent underlying momentum and buyer interest.
Range-bound outlook as downside risks dominate near-term movement
Looking out over the next few trading days, T is expected to remain range-bound between C$13.11 and C$13.93 as uncertainty persists. An upward move has a 38% probability, while a downside move is more likely at 62%. If the price breaks above C$13.61, a bullish extension could develop. Conversely, a fall below C$13.11 would likely trigger renewed selling momentum and reaffirm the broader downtrend.
Earlier, analysts noted that TELUS faced persistent downside risk following a major dividend cut and ongoing operational challenges. The current assessment strengthens this outlook, highlighting the importance of monitoring the C$13.11 support level for signs of renewed selling pressure in the days ahead.










-
 Afghanistan
-
 Albania
-
 Algeria
-
 Angola
-
 Argentina
-
 Armenia
-
 Australia
-
 Austria
-
 Azerbaijan
-
 Bahamas
-
 Bahrain
-
 Bangladesh
-
 Belarus
-
 Belgium
-
 Bolivia
-
 Botswana
-
 Brazil
-
 Brunei
-
 Bulgaria
-
 Cambodia
-
 Cameroon
-
 Canada
-
 Chile
-
 China
-
 Colombia
-
 Congo
-
 Costa Rica
-
 Cote d'Ivoire
-
 Croatia
-
 Cuba
-
 Cyprus
-
 Czechia
-
 DR Congo
-
 Denmark
-
 Dominican Republic
-
 Ecuador
-
 Egypt
-
 El Salvador
-
 Estonia
-
 Eswatini
-
 Ethiopia
-
 Finland
-
 France
-
 Georgia
-
 Germany
-
 Ghana
-
 Greece
-
 Haiti
-
 Hong Kong
-
 Hungary
-
 India
-
 Indonesia
-
 Iran, Islamic republic
-
 Iraq
-
 Ireland
-
 Israel
-
 Italy
-
 Jamaica
-
 Japan
-
 Jordan
-
 Kazakhstan
-
 Kenya
-
 Korea
-
 Kuwait
-
 Kyrgyzstan
-
 Laos
-
 Latvia
-
 Lebanon
-
 Lesotho
-
 Libya
-
 Lithuania
-
 Luxembourg
-
 Madagascar
-
 Malaysia
-
 Malta
-
 Mauritius
-
 Mexico
-
 Moldova
-
 Mongolia
-
 Montenegro
-
 Morocco
-
 Mozambique
-
 Myanmar
-
 Namibia
-
 Nepal
-
 Netherlands
-
 New Zealand
-
 Nigeria
-
 North Macedonia
-
 Norway
-
 Oman
-
 Pakistan
-
 Palestine
-
 Panama
-
 Papua New Guinea
-
 Paraguay
-
 Peru
-
 Philippines
-
 Poland
-
 Portugal
-
 Puerto Rico
-
 Qatar
-
 Reunion
-
 Romania
-
 Rwanda
-
 Saudi Arabia
-
 Serbia
-
 Singapore
-
 Slovakia
-
 Slovenia
-
 Somalia
-
 South Africa
-
 Spain
-
 Sri Lanka
-
 Sweden
-
 Switzerland
-
 Syria
-
 Taiwan
-
 Tajikistan
-
 Tanzania
-
 Thailand
-
 Trinidad and Tobago
-
 Tunisia
-
 Turkey
-
 UAE
-
 Uganda
-
 Ukraine
-
 United Kingdom
-
United States
-
 Uruguay
-
 Uzbekistan
-
 Venezuela
-
 Vietnam
-
 Yemen
-
 Zambia
-
 Zimbabwe
- Forex
- Crypto












