

Why is UiPath stock falling today? Sellers dominate trend; key support levels to watch

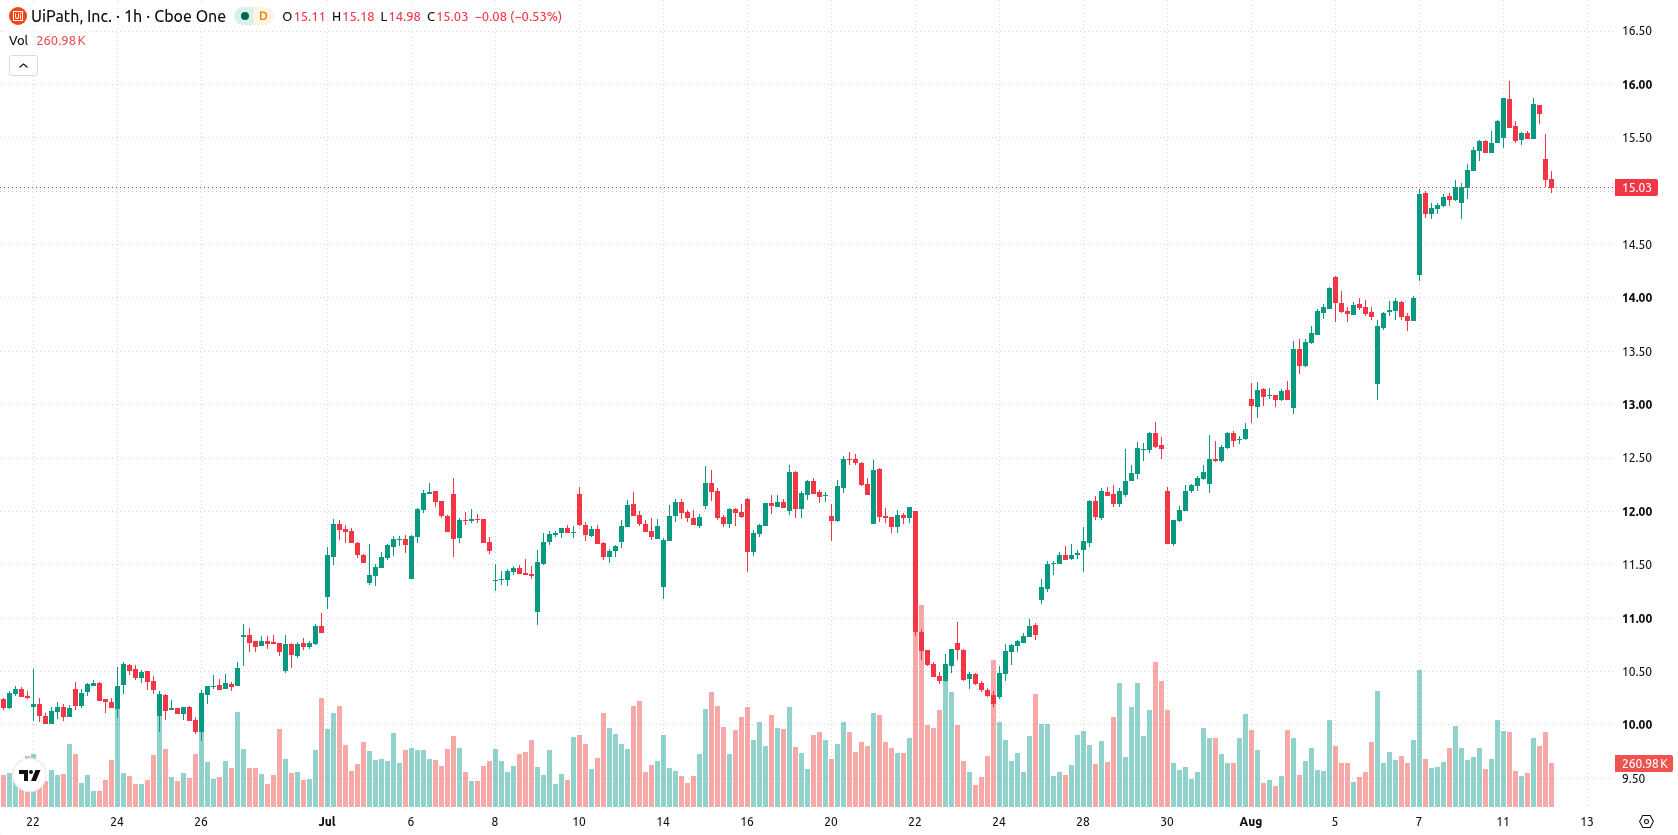
UiPath (PATH) stock is trading at $15.04 after slipping 4.33% on the day. The price is positioned below its key short-term moving averages but remains above medium- and long-term trend levels.
 13.32
14.22
Highlights
- UiPath stock trades below its short-term moving average, showing near-term weakness but keeps its medium- and long-term bullish structure.
- Momentum signals remain conflicting, with strong MACD and ADX upthrusts but dominant selling shown in several oscillators and a neutral RSI.
- Shares dropped 4.33% intraday to $15.04 and are expected to move within a $13.71 to $16.37 range over the next sessions.
Mixed momentum with technical support underpinning uncertainty
PATH is trading below the MA-20 at $15.36, with immediate support near the Ichimoku Kijun at $14.86. The price remains above both the MA-50 ($14.41) and MA-200 ($12.74) levels. Momentum signals are mixed: MACD is at a Strong Buy and ADX signals Buy, but CCI and Bull/Bear Power show prevailing seller influence. RSI is near 51 (neutral), Stoch RSI is Oversold, and Awesome Oscillator is neutral, highlighting uncertainty in directional cues.
Sideways trend favored as upside scenario faces resistance
Over the short term, PATH is expected to fluctuate between $13.71 and $16.37. The probability of an upward move is estimated at 59%, making a downward scenario less likely for now. Baseline expectations are for a sideways range; a bullish outcome would require a breakout above resistance, while further selling could push the stock below immediate support.
Earlier, analysts noted that UiPath’s technical momentum was supported by bullish signals but tempered by warnings of near-term consolidation. The current mixed momentum readings and price positioning relative to key moving averages now add uncertainty to the outlook, making the $13.71 support and $16.37 resistance important levels for traders to watch.










-
 Afghanistan
-
 Albania
-
 Algeria
-
 Angola
-
 Argentina
-
 Armenia
-
 Australia
-
 Austria
-
 Azerbaijan
-
 Bahamas
-
 Bahrain
-
 Bangladesh
-
 Belarus
-
 Belgium
-
 Bolivia
-
 Botswana
-
 Brazil
-
 Brunei
-
 Bulgaria
-
 Cambodia
-
 Cameroon
-
 Canada
-
 Chile
-
 China
-
 Colombia
-
 Congo
-
 Costa Rica
-
 Cote d'Ivoire
-
 Croatia
-
 Cuba
-
 Cyprus
-
 Czechia
-
 DR Congo
-
 Denmark
-
 Dominican Republic
-
 Ecuador
-
 Egypt
-
 El Salvador
-
 Estonia
-
 Eswatini
-
 Ethiopia
-
 Finland
-
 France
-
 Georgia
-
 Germany
-
 Ghana
-
 Greece
-
 Haiti
-
 Hong Kong
-
 Hungary
-
 India
-
 Indonesia
-
 Iran, Islamic republic
-
 Iraq
-
 Ireland
-
 Israel
-
 Italy
-
 Jamaica
-
 Japan
-
 Jordan
-
 Kazakhstan
-
 Kenya
-
 Korea
-
 Kuwait
-
 Kyrgyzstan
-
 Laos
-
 Latvia
-
 Lebanon
-
 Lesotho
-
 Libya
-
 Lithuania
-
 Luxembourg
-
 Madagascar
-
 Malaysia
-
 Malta
-
 Mauritius
-
 Mexico
-
 Moldova
-
 Mongolia
-
 Montenegro
-
 Morocco
-
 Mozambique
-
 Myanmar
-
 Namibia
-
 Nepal
-
 Netherlands
-
 New Zealand
-
 Nigeria
-
 North Macedonia
-
 Norway
-
 Oman
-
 Pakistan
-
 Palestine
-
 Panama
-
 Papua New Guinea
-
 Paraguay
-
 Peru
-
 Philippines
-
 Poland
-
 Portugal
-
 Puerto Rico
-
 Qatar
-
 Reunion
-
 Romania
-
 Rwanda
-
 Saudi Arabia
-
 Serbia
-
 Singapore
-
 Slovakia
-
 Slovenia
-
 Somalia
-
 South Africa
-
 Spain
-
 Sri Lanka
-
 Sweden
-
 Switzerland
-
 Syria
-
 Taiwan
-
 Tajikistan
-
 Tanzania
-
 Thailand
-
 Trinidad and Tobago
-
 Tunisia
-
 Turkey
-
 UAE
-
 Uganda
-
 Ukraine
-
 United Kingdom
-
United States
-
 Uruguay
-
 Uzbekistan
-
 Venezuela
-
 Vietnam
-
 Yemen
-
 Zambia
-
 Zimbabwe
- Forex
- Crypto












