

What's behind Spotify's latest 3.4% stock pullback?

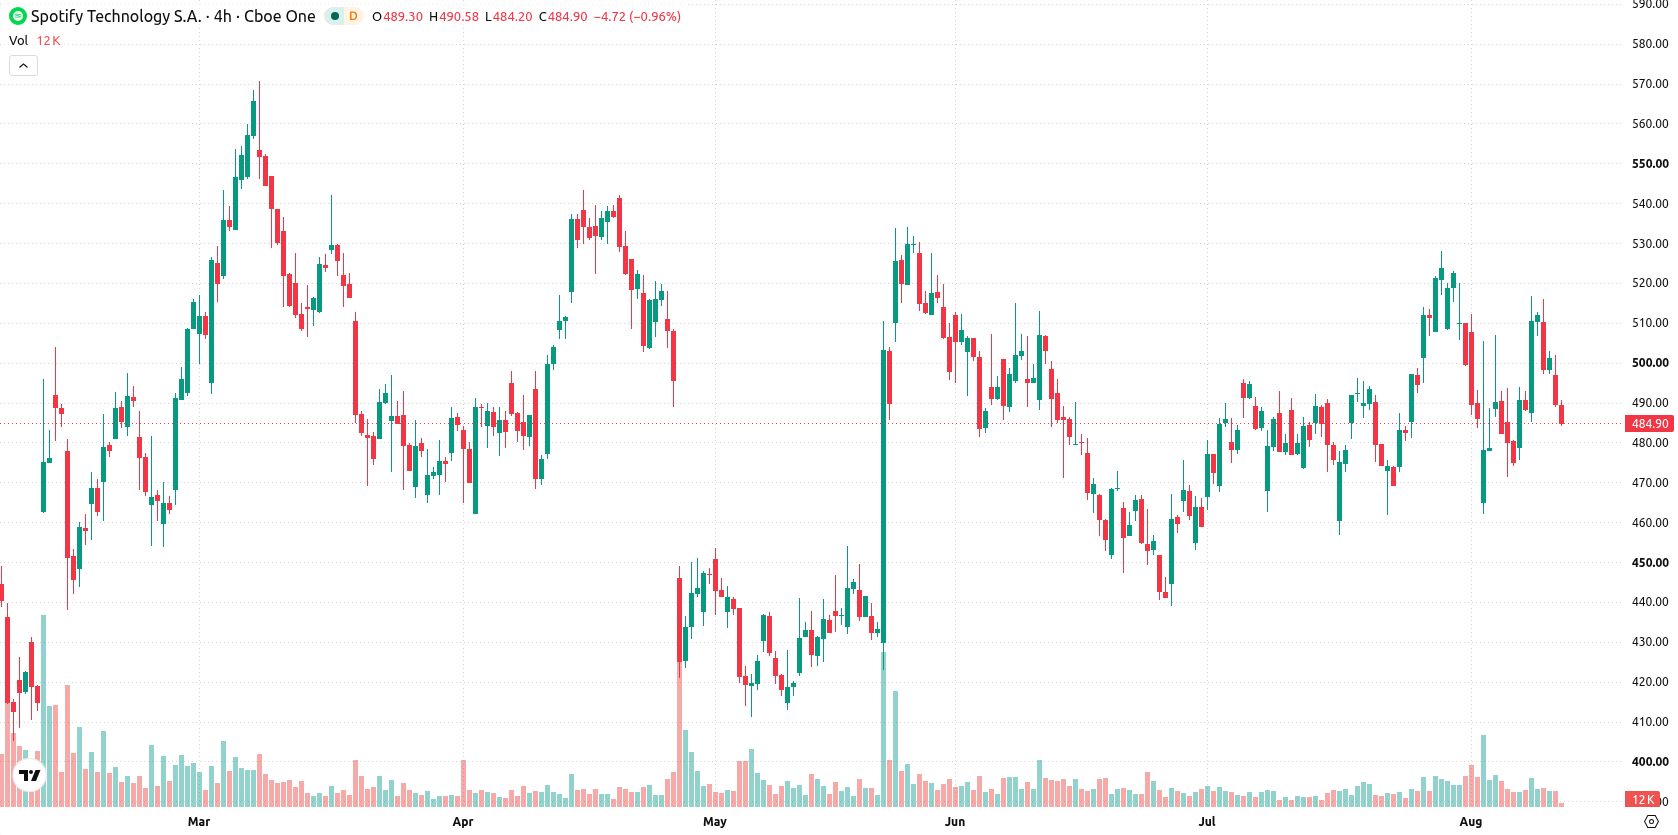
Spotify Technology S.A. (SPOT) dropped 3.35% as short-term downside pressure followed strong quarterly user and revenue growth, even as upbeat second quarter results and new product initiatives provided a positive backdrop. The move is supported by the stock remaining below its 20- and 200-day moving averages and lingering near-session lows, highlighting prevailing seller control despite bullish momentum signals.
 631.50
601.25
Highlights
- Spotify posted second quarter 2026 revenue growth of 14% to a record gross margin of 33.4%, with monthly active users up 12% to 777 million.
- Premium subscribers rose to 300 million and guidance targets €5.0 billion revenue and €670 million operating income for the third quarter 2026.
- Shares of Spotify remain under broad selling pressure, trading near session lows with expected range of $461.39 to $507.05 in the next five days.
Record user growth and AI adoption as selling persists post-results
Spotify reported second quarter 2026 results, with monthly active users reaching 777 million and Premium subscribers rising to 300 million, representing year-over-year growth of 12% and 9%, respectively. Quarterly revenue increased 14%, driven by Premium revenue gains and recent price adjustments, and gross margin reached a record 33.4%. Third quarter 2026 guidance was issued, with projected revenue of approximately €5.0 billion and operating income of €670 million, along with news that Spotify will begin labeling AI-generated artists in mid-September and that 25% of users now interact with AI features, though price action has remained under broader selling pressure.
Mixed momentum signals as bearish trend holds below key averages
Spotify is trading just below its 20-day moving average (MA-20) at $491.33, above the 50-day moving average (MA-50) at $483.95, and below the 200-day moving average (MA-200) at $517.23. This configuration points to short-term seller pressure, modest medium-term support, and a dominant bearish long-term trend, with the Ichimoku Kijun at $493.97 acting as near-term resistance. The closest support is at the MA-50 ($483.95), and the nearest resistance is at today's low ($486.73). Momentum indicators show a mixed setup: MACD gives a buy signal, ADX indicates weak trend strength, and both the RSI and CCI suggest only modest upward momentum, while the Stochastic RSI appears neutral. Bull/Bear Power shows buyers retain some intraday control, yet the forecast notes overbought risk. The current tone is bearish as the price trades near session lows amid a daily drop of $16.78 or 3.35%, with volatility at 3.09%. This downside action diverges from overall momentum buy signals.
Earlier, analysts noted that Spotify's strong subscriber and revenue growth supported short- and mid-term bullish momentum, even as longer-term technical signals remained mixed. The current downward move and breach of short-term support highlight a shift to seller control, making the $483.95 level a critical threshold for gauging whether downside risk toward $461.39 will intensify in the coming sessions.











-
 Afghanistan
-
 Albania
-
 Algeria
-
 Angola
-
 Argentina
-
 Armenia
-
 Australia
-
 Austria
-
 Azerbaijan
-
 Bahamas
-
 Bahrain
-
 Bangladesh
-
 Belarus
-
 Belgium
-
 Bolivia
-
 Botswana
-
 Brazil
-
 Brunei
-
 Bulgaria
-
 Cambodia
-
 Cameroon
-
 Canada
-
 Chile
-
 China
-
 Colombia
-
 Congo
-
 Costa Rica
-
 Cote d'Ivoire
-
 Croatia
-
 Cuba
-
 Cyprus
-
 Czechia
-
 DR Congo
-
 Denmark
-
 Dominican Republic
-
 Ecuador
-
 Egypt
-
 El Salvador
-
 Estonia
-
 Eswatini
-
 Ethiopia
-
 Finland
-
 France
-
 Georgia
-
 Germany
-
 Ghana
-
 Greece
-
 Haiti
-
 Hong Kong
-
 Hungary
-
 India
-
 Indonesia
-
 Iran, Islamic republic
-
 Iraq
-
 Ireland
-
 Israel
-
 Italy
-
 Jamaica
-
 Japan
-
 Jordan
-
 Kazakhstan
-
 Kenya
-
 Korea
-
 Kuwait
-
 Kyrgyzstan
-
 Laos
-
 Latvia
-
 Lebanon
-
 Lesotho
-
 Libya
-
 Lithuania
-
 Luxembourg
-
 Madagascar
-
 Malaysia
-
 Malta
-
 Mauritius
-
 Mexico
-
 Moldova
-
 Mongolia
-
 Montenegro
-
 Morocco
-
 Mozambique
-
 Myanmar
-
 Namibia
-
 Nepal
-
 Netherlands
-
 New Zealand
-
 Nigeria
-
 North Macedonia
-
 Norway
-
 Oman
-
 Pakistan
-
 Palestine
-
 Panama
-
 Papua New Guinea
-
 Paraguay
-
 Peru
-
 Philippines
-
 Poland
-
 Portugal
-
 Puerto Rico
-
 Qatar
-
 Reunion
-
 Romania
-
 Rwanda
-
 Saudi Arabia
-
 Serbia
-
 Singapore
-
 Slovakia
-
 Slovenia
-
 Somalia
-
 South Africa
-
 Spain
-
 Sri Lanka
-
 Sweden
-
 Switzerland
-
 Syria
-
 Taiwan
-
 Tajikistan
-
 Tanzania
-
 Thailand
-
 Trinidad and Tobago
-
 Tunisia
-
 Turkey
-
 UAE
-
 Uganda
-
 Ukraine
-
 United Kingdom
-
United States
-
 Uruguay
-
 Uzbekistan
-
 Venezuela
-
 Vietnam
-
 Yemen
-
 Zambia
-
 Zimbabwe
- Forex
- Crypto












