

SLM shares rise over 3% as technical momentum propels buyers

SLM Corporation (SLM) advanced 3.09% on the day, propelled by strong technical momentum as buyers continue to dominate intraday price action. The move is supported by SLM trading above its 20-day, 50-day, and 200-day moving averages, underscoring positive momentum across all time frames.
 17.26
17.54
Highlights
- SLM stock is trending higher, trading above key short-, medium-, and long-term moving averages around $28.
- Momentum indicators are mostly bullish with MACD and RSI in buy territory, though the ADX shows only modest trend strength.
- SLM stock has a near-term expected range of $27.57 to $28.43 with a 75% probability of further upside.
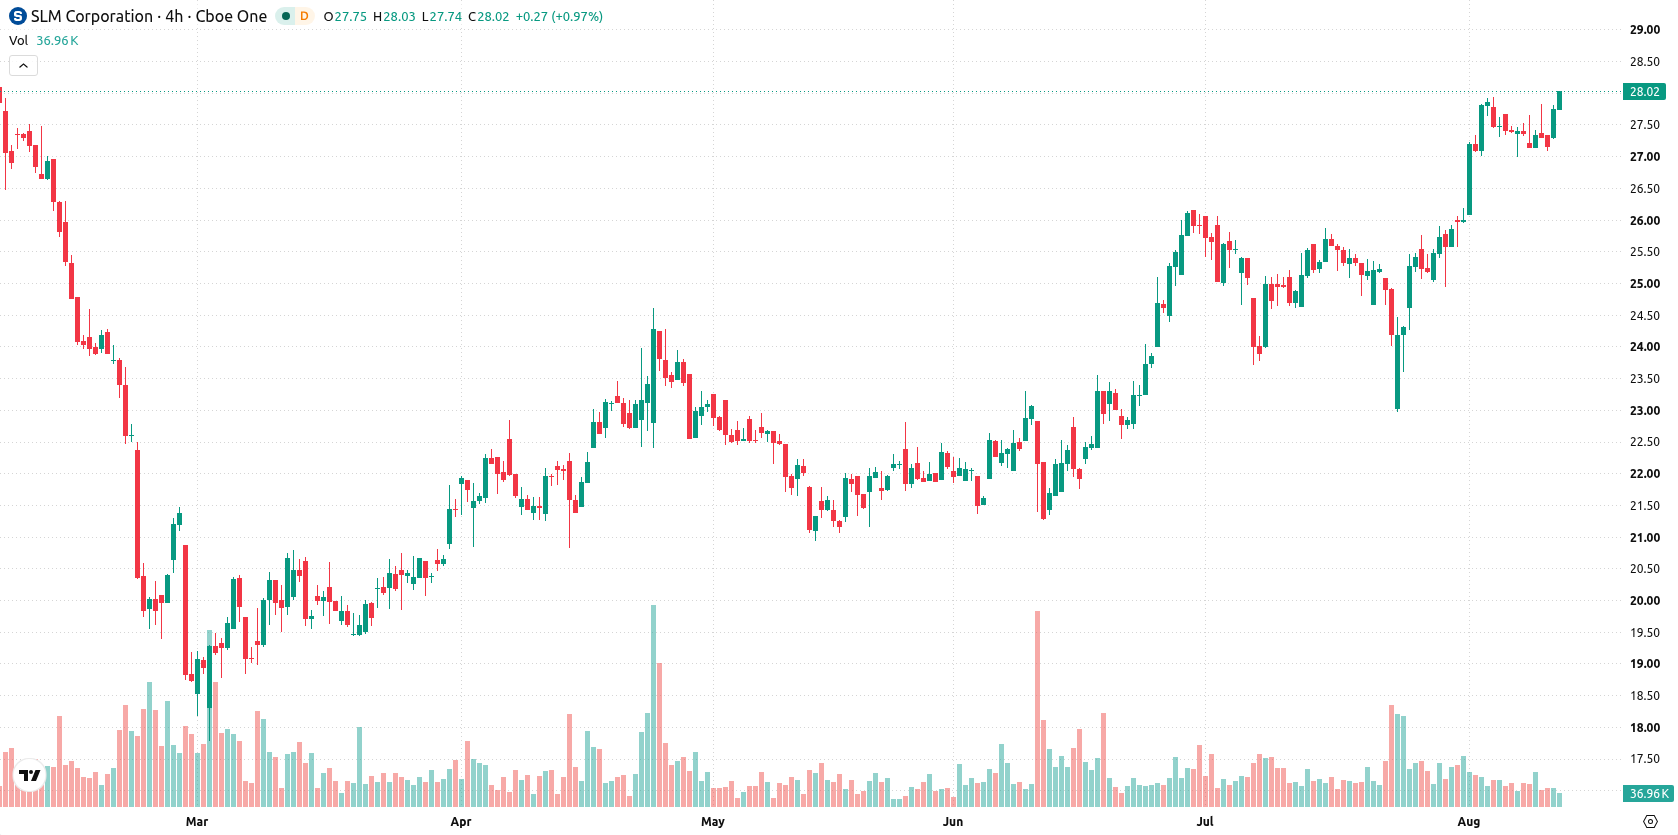
Buy signals prevail as trend aligns with firm momentum
SLM is trading above its 20-day, 50-day, and 200-day moving averages ($26.02, $24.6, and $24.58, respectively), indicating positive short-, medium-, and long-term trends. The near-term ceiling is $28.43, and the near-term floor is today’s high at $27.94, with the bullish trend reinforced by the alignment of the MA-50 above the MA-200. Momentum indicators reflect a favorable setup, with MACD in buy territory, RSI and CCI both showing a buy tilt without clear overbought signals, and Bull/Bear Power (BBP) positive at 1.16, suggesting sustained buyer strength despite a neutral ADX reading. Current trading is near the upper end of today’s range, with firm momentum and intraday volatility at 2.91%. Some oscillators give neutral signals, adding a hint of divergence.
Earlier, analysts noted that SLM had established bullish technical momentum alongside stable credit metrics, though with mixed signals from some indicators. The current analysis strengthens this view, as recent price action and technicals reinforce a prevailing upward bias, making a breakout above $28.43 the key level to monitor for a potential bullish acceleration.










-
 Afghanistan
-
 Albania
-
 Algeria
-
 Angola
-
 Argentina
-
 Armenia
-
 Australia
-
 Austria
-
 Azerbaijan
-
 Bahamas
-
 Bahrain
-
 Bangladesh
-
 Belarus
-
 Belgium
-
 Bolivia
-
 Botswana
-
 Brazil
-
 Brunei
-
 Bulgaria
-
 Cambodia
-
 Cameroon
-
 Canada
-
 Chile
-
 China
-
 Colombia
-
 Congo
-
 Costa Rica
-
 Cote d'Ivoire
-
 Croatia
-
 Cuba
-
 Cyprus
-
 Czechia
-
 DR Congo
-
 Denmark
-
 Dominican Republic
-
 Ecuador
-
 Egypt
-
 El Salvador
-
 Estonia
-
 Eswatini
-
 Ethiopia
-
 Finland
-
 France
-
 Georgia
-
 Germany
-
 Ghana
-
 Greece
-
 Haiti
-
 Hong Kong
-
 Hungary
-
 India
-
 Indonesia
-
 Iran, Islamic republic
-
 Iraq
-
 Ireland
-
 Israel
-
 Italy
-
 Jamaica
-
 Japan
-
 Jordan
-
 Kazakhstan
-
 Kenya
-
 Korea
-
 Kuwait
-
 Kyrgyzstan
-
 Laos
-
 Latvia
-
 Lebanon
-
 Lesotho
-
 Libya
-
 Lithuania
-
 Luxembourg
-
 Madagascar
-
 Malaysia
-
 Malta
-
 Mauritius
-
 Mexico
-
 Moldova
-
 Mongolia
-
 Montenegro
-
 Morocco
-
 Mozambique
-
 Myanmar
-
 Namibia
-
 Nepal
-
 Netherlands
-
 New Zealand
-
 Nigeria
-
 North Macedonia
-
 Norway
-
 Oman
-
 Pakistan
-
 Palestine
-
 Panama
-
 Papua New Guinea
-
 Paraguay
-
 Peru
-
 Philippines
-
 Poland
-
 Portugal
-
 Puerto Rico
-
 Qatar
-
 Reunion
-
 Romania
-
 Rwanda
-
 Saudi Arabia
-
 Serbia
-
 Singapore
-
 Slovakia
-
 Slovenia
-
 Somalia
-
 South Africa
-
 Spain
-
 Sri Lanka
-
 Sweden
-
 Switzerland
-
 Syria
-
 Taiwan
-
 Tajikistan
-
 Tanzania
-
 Thailand
-
 Trinidad and Tobago
-
 Tunisia
-
 Turkey
-
 UAE
-
 Uganda
-
 Ukraine
-
 United Kingdom
-
United States
-
 Uruguay
-
 Uzbekistan
-
 Venezuela
-
 Vietnam
-
 Yemen
-
 Zambia
-
 Zimbabwe
- Forex
- Crypto












