

Dutch Bros stock forecast: Full-year outlook revised higher

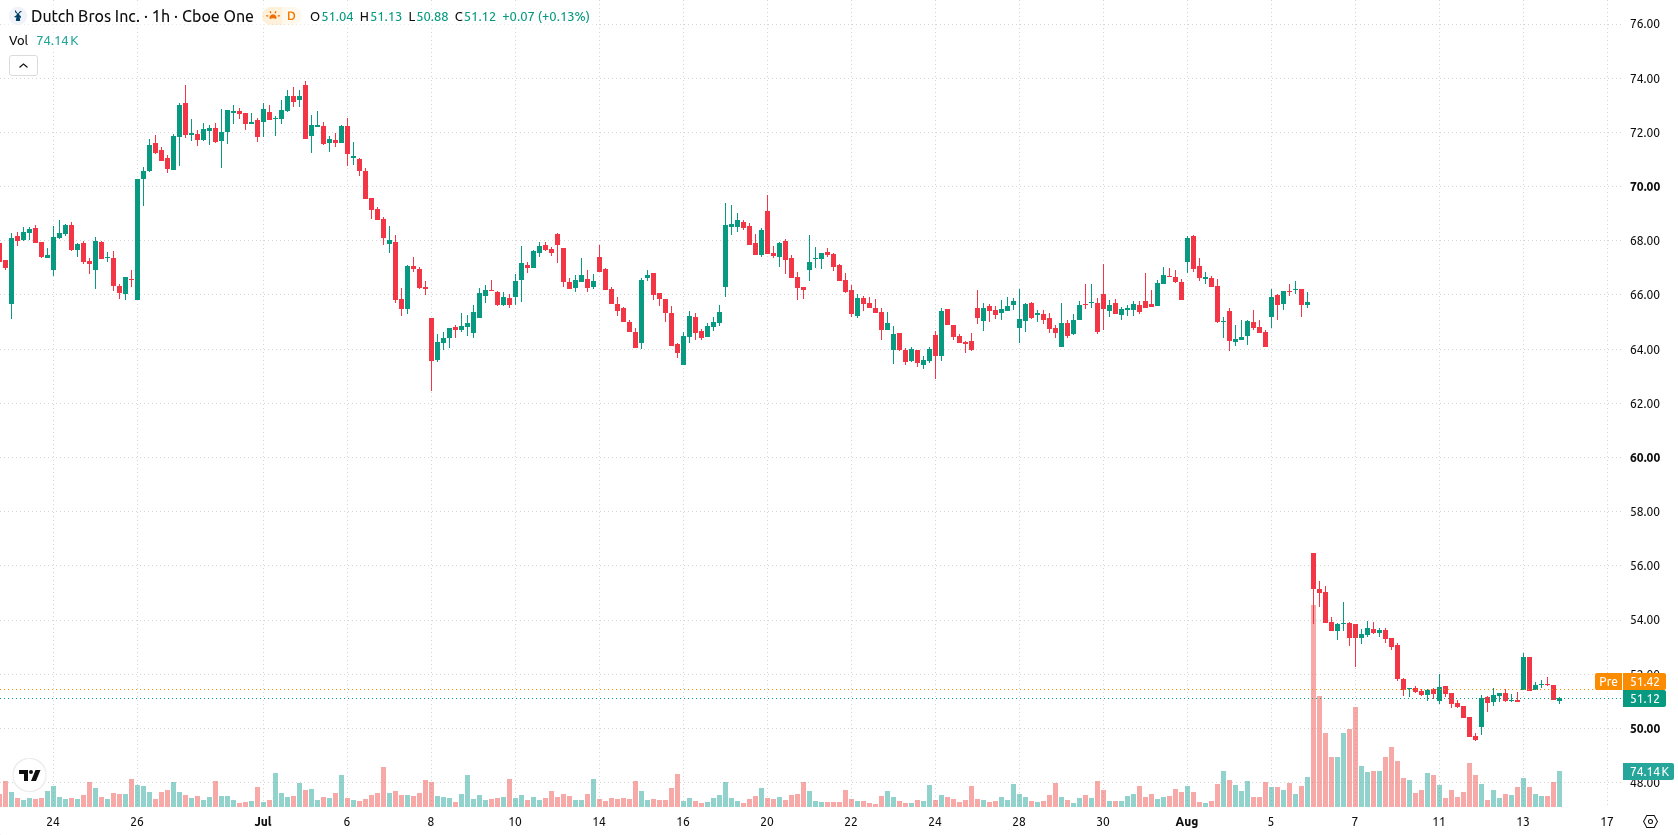
Dutch Bros (BROS) stock is trading at $51.13, registering a modest gain for the day. Shares are positioned above their short-term moving averages while remaining below key medium- and long-term trend levels.
 35.90
37.37
Highlights
- Dutch Bros reported second quarter earnings and revenue above expectations, with total revenues up 32% year over year.
- The company acquired franchise rights for 31 Phoenix stores and agreed to acquire up to 65 Salad and Go assets in four states.
- Shares of Dutch Bros trade above short-term support but below key moving averages, with technicals suggesting a high probability of a move to the $49.16 to $53.10 range and downside pressure dominating in the near term.
Earnings beat and acquisitions drive growth outlook
Dutch Bros reported better-than-expected second quarter earnings and revenue, coupled with same-store sales growth and an upward revision to its full-year outlook, as noted by Pluang. This financial outperformance, including a 32% year-over-year rise in total revenues and a 28% increase in adjusted EBITDA for the quarter, demonstrates the company's ongoing business expansion. Operationally, Dutch Bros completed the acquisition of franchise rights and assets for 31 Phoenix-area locations and entered an agreement to acquire up to 65 Salad and Go site assets across four states, pending closing conditions, according to Fool. Together, these developments highlight accelerating growth initiatives and support a constructive backdrop for the stock.
Initial resistance persists as negative momentum dominates
BROS is trading above the MA-20 at $51.06, but remains below the MA-50 ($54.22) and MA-200 ($57.69) on the daily chart. The Ichimoku Kijun level at $51.14 marks initial resistance. Momentum signals are negative: MACD issues a Strong Sell, ADX points to continued downside pressure, and the RSI stands at 41.05, indicating a lack of oversold conditions. Stoch RSI and CCI both register neutral, while Bull/Bear Power reflects seller dominance on the intraday charts.
Downside risk prevails as consolidation expected near support
Over the coming 2–3 trading days, BROS is likely to fluctuate within a typical volatility band of $49.16 to $53.10. The probability of a move downward is assessed as very high, while the potential for a sustained rise is low within this window. The baseline scenario is for price to consolidate within this corridor. Should BROS break above $51.14, a test of the range highs is possible; failure to hold near $49.16 would open room for further downside.
Earlier, analysts noted that Dutch Bros faced persistent technical pressure and a high probability of further downside despite its growth prospects. With the stock now consolidating beneath major trend levels and negative momentum prevailing, traders should monitor for a potential break below $49.16 that could accelerate a renewed move lower in the near term.






Latest Dutch Bros News




-
 Afghanistan
-
 Albania
-
 Algeria
-
 Angola
-
 Argentina
-
 Armenia
-
 Australia
-
 Austria
-
 Azerbaijan
-
 Bahamas
-
 Bahrain
-
 Bangladesh
-
 Belarus
-
 Belgium
-
 Bolivia
-
 Botswana
-
 Brazil
-
 Brunei
-
 Bulgaria
-
 Cambodia
-
 Cameroon
-
 Canada
-
 Chile
-
 China
-
 Colombia
-
 Congo
-
 Costa Rica
-
 Cote d'Ivoire
-
 Croatia
-
 Cuba
-
 Cyprus
-
 Czechia
-
 DR Congo
-
 Denmark
-
 Dominican Republic
-
 Ecuador
-
 Egypt
-
 El Salvador
-
 Estonia
-
 Eswatini
-
 Ethiopia
-
 Finland
-
 France
-
 Georgia
-
 Germany
-
 Ghana
-
 Greece
-
 Haiti
-
 Hong Kong
-
 Hungary
-
 India
-
 Indonesia
-
 Iran, Islamic republic
-
 Iraq
-
 Ireland
-
 Israel
-
 Italy
-
 Jamaica
-
 Japan
-
 Jordan
-
 Kazakhstan
-
 Kenya
-
 Korea
-
 Kuwait
-
 Kyrgyzstan
-
 Laos
-
 Latvia
-
 Lebanon
-
 Lesotho
-
 Libya
-
 Lithuania
-
 Luxembourg
-
 Madagascar
-
 Malaysia
-
 Malta
-
 Mauritius
-
 Mexico
-
 Moldova
-
 Mongolia
-
 Montenegro
-
 Morocco
-
 Mozambique
-
 Myanmar
-
 Namibia
-
 Nepal
-
 Netherlands
-
 New Zealand
-
 Nigeria
-
 North Macedonia
-
 Norway
-
 Oman
-
 Pakistan
-
 Palestine
-
 Panama
-
 Papua New Guinea
-
 Paraguay
-
 Peru
-
 Philippines
-
 Poland
-
 Portugal
-
 Puerto Rico
-
 Qatar
-
 Reunion
-
 Romania
-
 Rwanda
-
 Saudi Arabia
-
 Serbia
-
 Singapore
-
 Slovakia
-
 Slovenia
-
 Somalia
-
 South Africa
-
 Spain
-
 Sri Lanka
-
 Sweden
-
 Switzerland
-
 Syria
-
 Taiwan
-
 Tajikistan
-
 Tanzania
-
 Thailand
-
 Trinidad and Tobago
-
 Tunisia
-
 Turkey
-
 UAE
-
 Uganda
-
 Ukraine
-
 United Kingdom
-
United States
-
 Uruguay
-
 Uzbekistan
-
 Venezuela
-
 Vietnam
-
 Yemen
-
 Zambia
-
 Zimbabwe
- Forex
- Crypto












