

Will UiPath stock hold $15.79 support as weak momentum pressures buyers?

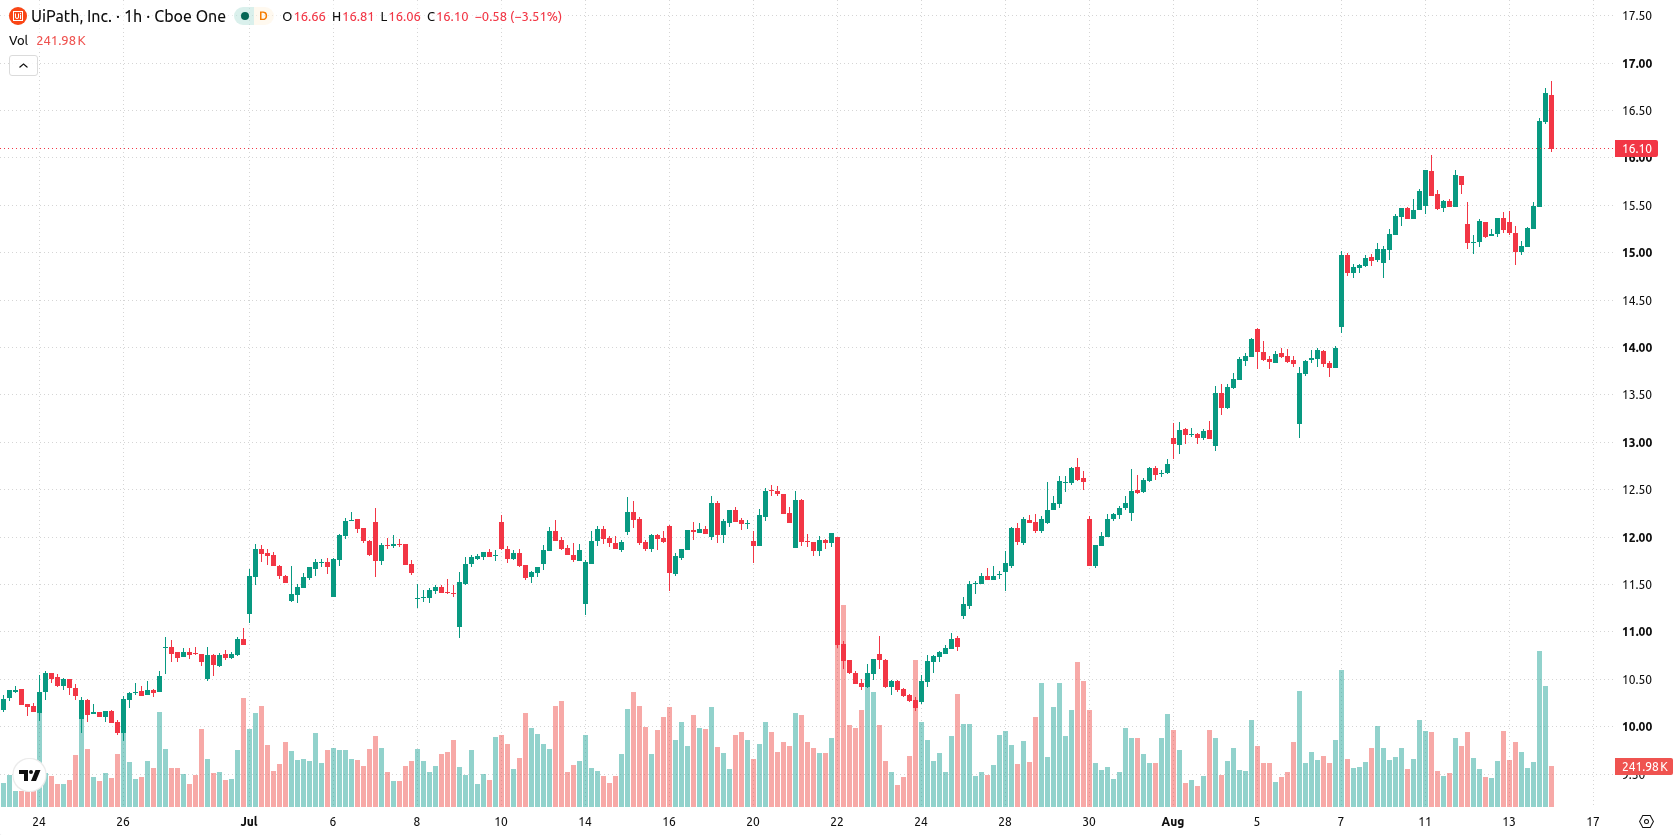
UiPath Inc. (PATH) stock is trading at $16.06, down 3.75% for the day, marking an intraday pullback near the session's lows. The stock remains positioned above its key moving averages, indicating support from both short- and long-term trends.
 14.02
14.32
Highlights
- UiPath reported positive operating and net income as profitability improved, supporting its ongoing turnaround strategy.
- The company ended the period with $632.2 million in cash, $1.31 billion in liquidity, $72 million in long-term debt, and $1.90 billion in equity.
- PATH trades with bullish technical momentum and a projected range of $15.17 to $18.08, though intraday weakness signals possible near-term volatility.
Financial flexibility expands as profitability and cash rise amid selling
UiPath achieved positive operating and net income alongside improving profitability metrics, reinforcing its turnaround efforts, according to Stockstotrade. Data from Stockstotrade further showed the company ending the period with $632.2 million in cash and $1.31 billion in cash plus short-term investments, while maintaining long-term debt near $72 million and total liabilities of around $1 billion against $1.90 billion of equity. These developments highlight UiPath's greater financial flexibility and strengthen its balance sheet, though price action has remained under broader selling pressure.
Overbought risk emerges as bullish momentum confronts resistance zone
PATH is holding above the MA-20 at $15.5 and MA-50 at $14.95 on the hourly chart, as well as remaining above the MA-200 at $12.74 on the daily chart. The Ichimoku Kijun on the daily timeframe is at $15.79, providing immediate support. Among momentum indicators, MACD, ADX, and Awesome Oscillator indicate buying pressure, and RSI is in buy territory. However, CCI and Bull/Bear Power are both registering overbought levels, while the Stochastic RSI shows a strong sell, suggesting a possible reversal or at least short-term exhaustion. This mix points to broad bullishness in structure but a notable risk of corrective volatility if buyers lose their dominance in the immediate term.
Upside favored as price eyes range between immediate support and resistance
In the coming sessions, PATH is expected to trade within a range of $15.17 to $18.08, representing a typical volatility band relative to current levels. The probability of an upward move remains high at 77%, while the downside scenario is less likely. If the price consolidates near its current position, expect a sideways interval between immediate support at $15.79 and resistance near $18.08. A breakout above resistance triggers further bullish continuation, while a drop below $15.79 would indicate a shift toward renewed selling.
Earlier, analysts noted that UiPath’s outlook was characterized by mixed momentum signals and a broad expectation of sideways movement within established technical bands. The latest financial improvements and strengthened technical support now reinforce a bullish bias, but traders should monitor the $15.79 level closely as a loss of support there could signal increased downside risk.










-
 Afghanistan
-
 Albania
-
 Algeria
-
 Angola
-
 Argentina
-
 Armenia
-
 Australia
-
 Austria
-
 Azerbaijan
-
 Bahamas
-
 Bahrain
-
 Bangladesh
-
 Belarus
-
 Belgium
-
 Bolivia
-
 Botswana
-
 Brazil
-
 Brunei
-
 Bulgaria
-
 Cambodia
-
 Cameroon
-
 Canada
-
 Chile
-
 China
-
 Colombia
-
 Congo
-
 Costa Rica
-
 Cote d'Ivoire
-
 Croatia
-
 Cuba
-
 Cyprus
-
 Czechia
-
 DR Congo
-
 Denmark
-
 Dominican Republic
-
 Ecuador
-
 Egypt
-
 El Salvador
-
 Estonia
-
 Eswatini
-
 Ethiopia
-
 Finland
-
 France
-
 Georgia
-
 Germany
-
 Ghana
-
 Greece
-
 Haiti
-
 Hong Kong
-
 Hungary
-
 India
-
 Indonesia
-
 Iran, Islamic republic
-
 Iraq
-
 Ireland
-
 Israel
-
 Italy
-
 Jamaica
-
 Japan
-
 Jordan
-
 Kazakhstan
-
 Kenya
-
 Korea
-
 Kuwait
-
 Kyrgyzstan
-
 Laos
-
 Latvia
-
 Lebanon
-
 Lesotho
-
 Libya
-
 Lithuania
-
 Luxembourg
-
 Madagascar
-
 Malaysia
-
 Malta
-
 Mauritius
-
 Mexico
-
 Moldova
-
 Mongolia
-
 Montenegro
-
 Morocco
-
 Mozambique
-
 Myanmar
-
 Namibia
-
 Nepal
-
 Netherlands
-
 New Zealand
-
 Nigeria
-
 North Macedonia
-
 Norway
-
 Oman
-
 Pakistan
-
 Palestine
-
 Panama
-
 Papua New Guinea
-
 Paraguay
-
 Peru
-
 Philippines
-
 Poland
-
 Portugal
-
 Puerto Rico
-
 Qatar
-
 Reunion
-
 Romania
-
 Rwanda
-
 Saudi Arabia
-
 Serbia
-
 Singapore
-
 Slovakia
-
 Slovenia
-
 Somalia
-
 South Africa
-
 Spain
-
 Sri Lanka
-
 Sweden
-
 Switzerland
-
 Syria
-
 Taiwan
-
 Tajikistan
-
 Tanzania
-
 Thailand
-
 Trinidad and Tobago
-
 Tunisia
-
 Turkey
-
 UAE
-
 Uganda
-
 Ukraine
-
 United Kingdom
-
United States
-
 Uruguay
-
 Uzbekistan
-
 Venezuela
-
 Vietnam
-
 Yemen
-
 Zambia
-
 Zimbabwe
- Forex
- Crypto












