

$2.1 billion writedown weighs on TELUS stock near C$13.3 support

TELUS (T) stock is trading at C$13.49 after a modest gain on the day. The price sits above its key short- and medium-term moving averages, suggesting some short-term resilience amid low volatility.
 13.80
13.80
Highlights
- TELUS reduced its quarterly dividend by 55% to $0.1875 per share, cutting the immediate cash yield for investors.
- TELUS reported a $2.1 billion writedown and an $1.8 billion net loss for the second quarter of 2026 under new leadership.
- Shares of TELUS are expected to trade in a C$13.3 to C$13.76 range with mixed momentum signals and possible sharp moves if key levels break.
Dividend cut and writedown reshape sentiment as balance sheet risks rise
TELUS cut its quarterly dividend by 55%, reducing the payout from $0.4184 to $0.1875 per share as part of its second-quarter 2026 financial results under new president and CEO Victor Dodig. This move substantially lowers the immediate cash yield for investors and may prompt rebalancing from income-oriented shareholders. In parallel, TELUS disclosed a $2.1 billion writedown and an $1.8 billion net loss for the quarter, highlighting ongoing financial headwinds, according to Finance Yahoo. Together, these developments frame current sentiment around balance sheet risk and the company's evolving capital allocation priorities.
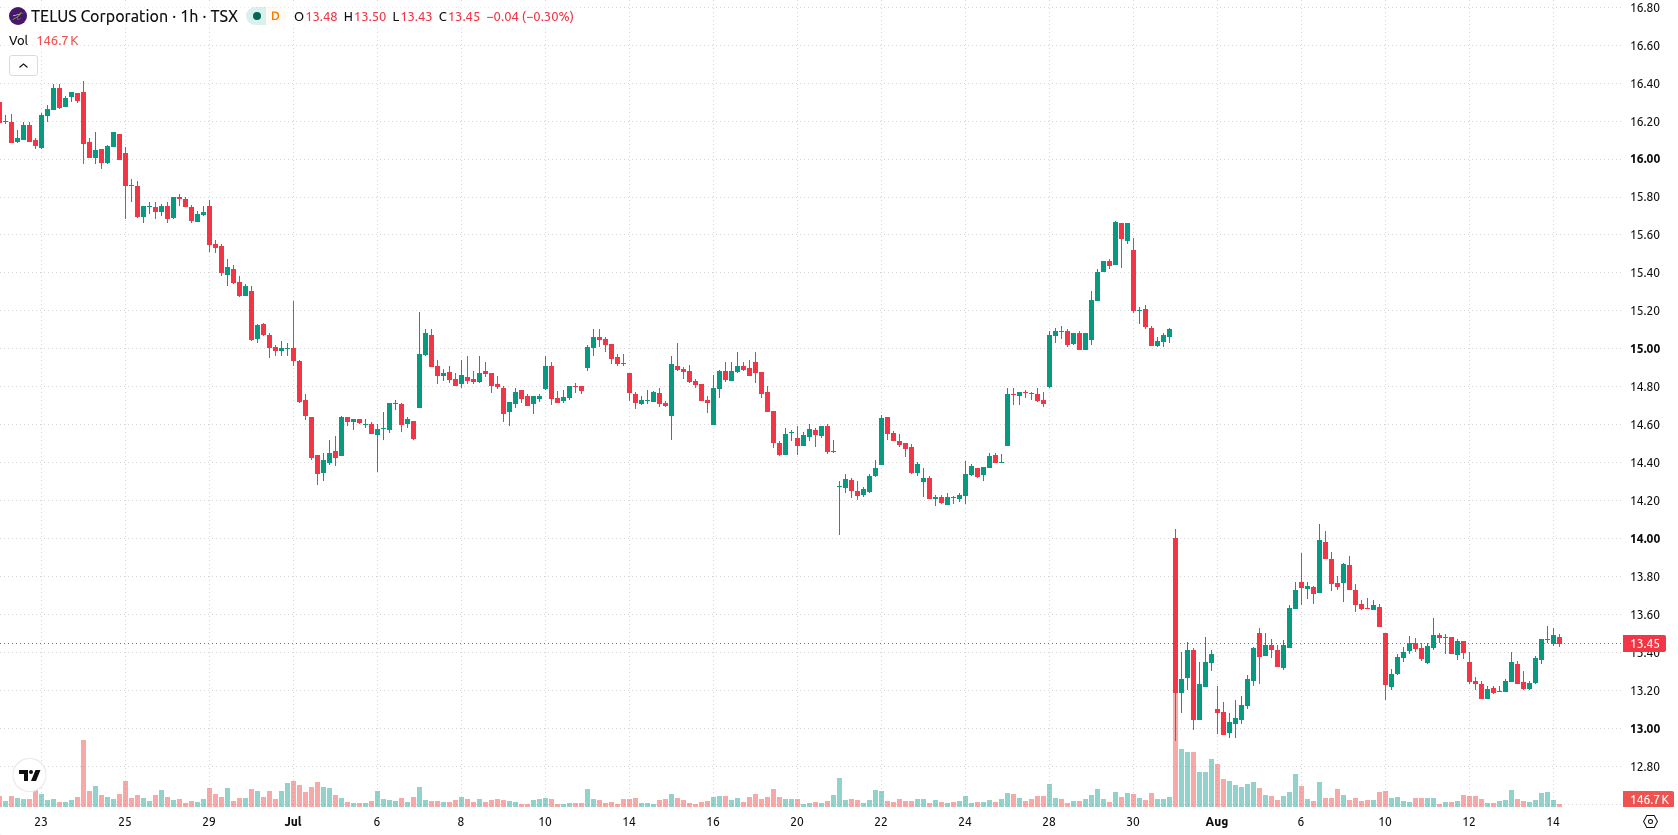
Mixed momentum as price nears support amid overbought signals
On the hourly chart, T recently traded above both its MA-20 at C$13.33 and MA-50 at C$13.48, while on the daily timeframe, it remains far below the MA-200 at C$17.49. The Ichimoku Kijun line at C$13.37 serves as nearby support. Key indicators present a mixed technical picture: MACD and ADX show neutral momentum, but bullish signals are seen from RSI at 54.33, CCI, Bull/Bear Power, and the Awesome Oscillator, all in buy mode. However, the Stochastic RSI is overbought, suggesting a potential loss of upward momentum and highlighting the risk of sharp moves should support or resistance levels break.
Rangebound trading as buyers and sellers test volatility bands
Over the coming days, T is expected to remain within a volatility band of C$13.3 to C$13.76. The most probable scenario is continued rangebound trading as buyers and sellers test these boundaries. A break above C$13.76 would indicate short-term bullish momentum, while a drop below C$13.3 could open the door to further downside risk.
Earlier, analysts noted that TELUS faced ongoing downside risks following its significant dividend cut, large net loss, and renewed leadership focus on deleveraging. Currently, the stock shows signs of technical stabilization but remains sensitive to range breaks, with C$13.76 as a key upside level and C$13.3 as important support to monitor for a directional move.










-
 Afghanistan
-
 Albania
-
 Algeria
-
 Angola
-
 Argentina
-
 Armenia
-
 Australia
-
 Austria
-
 Azerbaijan
-
 Bahamas
-
 Bahrain
-
 Bangladesh
-
 Belarus
-
 Belgium
-
 Bolivia
-
 Botswana
-
 Brazil
-
 Brunei
-
 Bulgaria
-
 Cambodia
-
 Cameroon
-
 Canada
-
 Chile
-
 China
-
 Colombia
-
 Congo
-
 Costa Rica
-
 Cote d'Ivoire
-
 Croatia
-
 Cuba
-
 Cyprus
-
 Czechia
-
 DR Congo
-
 Denmark
-
 Dominican Republic
-
 Ecuador
-
 Egypt
-
 El Salvador
-
 Estonia
-
 Eswatini
-
 Ethiopia
-
 Finland
-
 France
-
 Georgia
-
 Germany
-
 Ghana
-
 Greece
-
 Haiti
-
 Hong Kong
-
 Hungary
-
 India
-
 Indonesia
-
 Iran, Islamic republic
-
 Iraq
-
 Ireland
-
 Israel
-
 Italy
-
 Jamaica
-
 Japan
-
 Jordan
-
 Kazakhstan
-
 Kenya
-
 Korea
-
 Kuwait
-
 Kyrgyzstan
-
 Laos
-
 Latvia
-
 Lebanon
-
 Lesotho
-
 Libya
-
 Lithuania
-
 Luxembourg
-
 Madagascar
-
 Malaysia
-
 Malta
-
 Mauritius
-
 Mexico
-
 Moldova
-
 Mongolia
-
 Montenegro
-
 Morocco
-
 Mozambique
-
 Myanmar
-
 Namibia
-
 Nepal
-
 Netherlands
-
 New Zealand
-
 Nigeria
-
 North Macedonia
-
 Norway
-
 Oman
-
 Pakistan
-
 Palestine
-
 Panama
-
 Papua New Guinea
-
 Paraguay
-
 Peru
-
 Philippines
-
 Poland
-
 Portugal
-
 Puerto Rico
-
 Qatar
-
 Reunion
-
 Romania
-
 Rwanda
-
 Saudi Arabia
-
 Serbia
-
 Singapore
-
 Slovakia
-
 Slovenia
-
 Somalia
-
 South Africa
-
 Spain
-
 Sri Lanka
-
 Sweden
-
 Switzerland
-
 Syria
-
 Taiwan
-
 Tajikistan
-
 Tanzania
-
 Thailand
-
 Trinidad and Tobago
-
 Tunisia
-
 Turkey
-
 UAE
-
 Uganda
-
 Ukraine
-
 United Kingdom
-
United States
-
 Uruguay
-
 Uzbekistan
-
 Venezuela
-
 Vietnam
-
 Yemen
-
 Zambia
-
 Zimbabwe
- Forex
- Crypto












