


Credo Technology Group Holding Ltd (CRDO) slid 4.13% as sustained technical selling pressure took control following a downside gap. The move contradicts the broader bullish structure, with the asset still trading above its key 20-day, 50-day, and 200-day moving averages.
 177.19
212.22
177.19
212.22
Highlights
- Credo Technology stock trades in a bullish technical structure above key moving averages across all time frames.
- Momentum indicators show mixed signals, with buying pressure strong but multiple overbought warnings, as the stock closed at $255.02, down 4.13%.
- The expected five-day range is $230.95 to $279.09, with a 77% probability of upside if the price moves above $264.66.
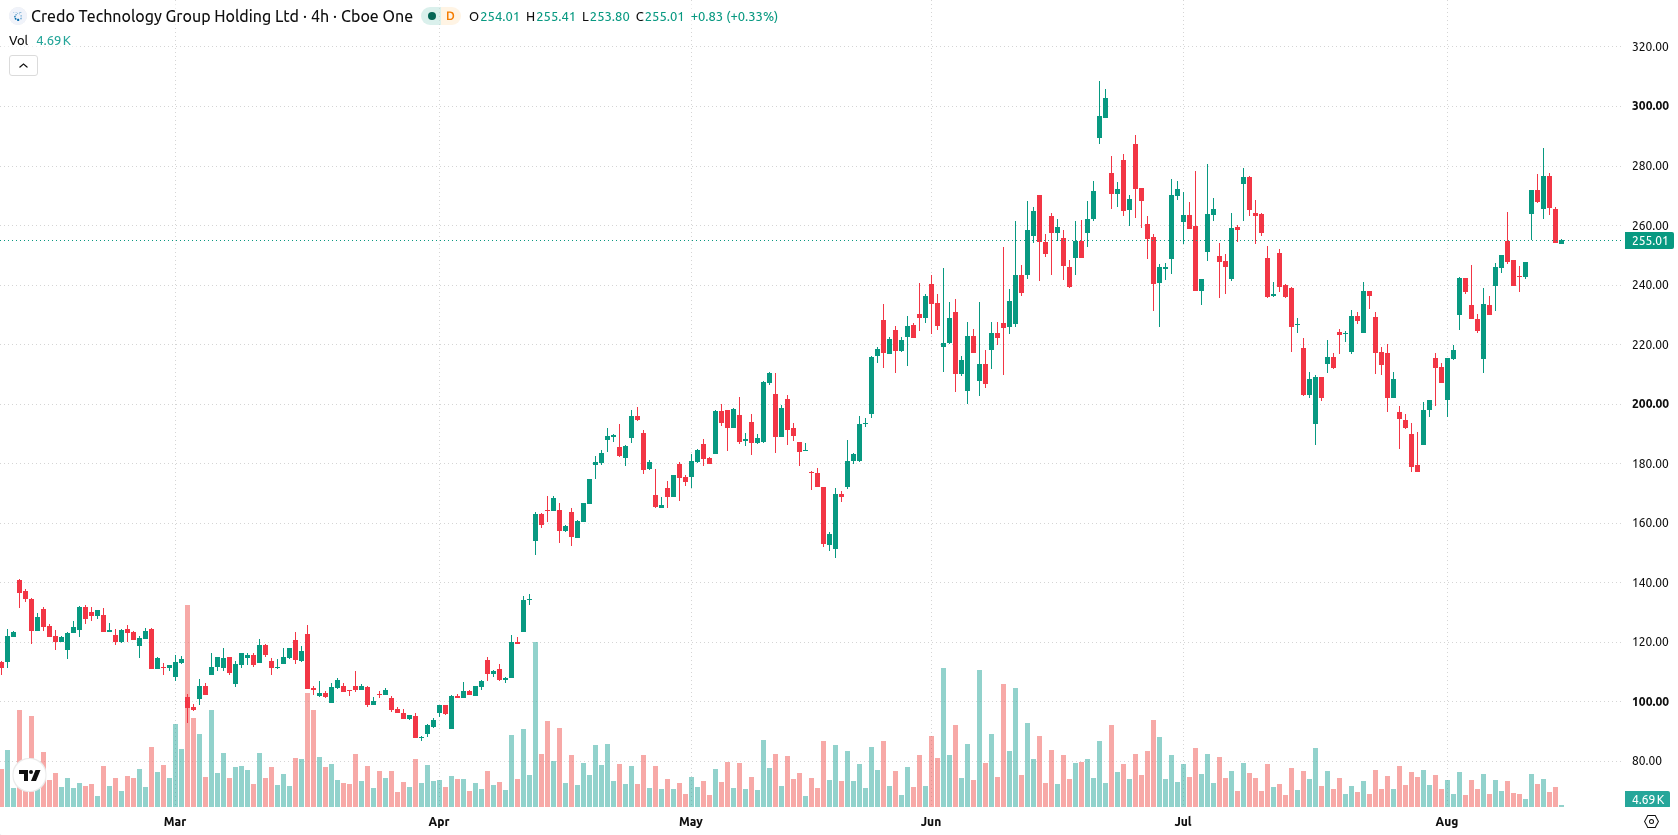
Bullish momentum signals mix with overbought risk at technical boundaries
Credo Technology is trading above its 20-day, 50-day, and 200-day moving averages at $224.27, $238.48, and $170.57 respectively, reflecting a bullish structure across short-, medium-, and long-term trends. The Ichimoku Kijun at $231.39 acts as a support, with the near-term ceiling at $264.66 and the floor at $254.65 providing immediate resistance and support. Momentum signals are mixed: the Moving Average Convergence Divergence (MACD) and Relative Strength Index (RSI) favor the buyers, but the Commodity Channel Index (CCI), Stochastic RSI, and Bull/Bear Power (BBP) all indicate strong overbought conditions, with BBP confirming dominance by buyers. The Awesome Oscillator (AO) also supports the prevailing bullish momentum. The stock last traded at $255.02, down 4.13% on the day after a downside gap of $1.33 (about 0.5%), and is currently near the session low. Intraday volatility stands at 3.93%, and the overall tone signals selling pressure following the gap lower, contrasting with the underlying bullish momentum.
Earlier, analysts noted that Credo Technology's strong financial performance and institutional accumulation were driving a prevailing bullish technical structure. The current downside gap and selling pressure add a new dimension, making sustained action above the near-term ceiling at $264.66 a key level for confirming further upside momentum.









-
 Afghanistan
-
 Albania
-
 Algeria
-
 Angola
-
 Argentina
-
 Armenia
-
 Australia
-
 Austria
-
 Azerbaijan
-
 Bahamas
-
 Bahrain
-
 Bangladesh
-
 Belarus
-
 Belgium
-
 Bolivia
-
 Botswana
-
 Brazil
-
 Brunei
-
 Bulgaria
-
 Cambodia
-
 Cameroon
-
 Canada
-
 Chile
Chile
-
 China
China
-
 Colombia
-
 Congo
Congo
-
 Costa Rica
-
 Cote d'Ivoire
-
 Croatia
-
 Cuba
Cuba
-
 Cyprus
-
 Czechia
-
 DR Congo
-
 Denmark
-
 Dominican Republic
-
 Ecuador
-
 Egypt
Egypt
-
 El Salvador
-
 Estonia
-
 Eswatini
-
 Ethiopia
-
 Finland
-
 France
-
 Georgia
-
 Germany
-
 Ghana
Ghana
-
 Greece
-
 Haiti
Haiti
-
 Hong Kong
-
 Hungary
-
 India
India
-
 Indonesia
-
 Iran, Islamic republic
-
 Iraq
Iraq
-
 Ireland
-
 Israel
-
 Italy
Italy
-
 Jamaica
-
 Japan
Japan
-
 Jordan
-
 Kazakhstan
-
 Kenya
Kenya
-
 Korea
Korea
-
 Kuwait
-
 Kyrgyzstan
-
 Laos
Laos
-
 Latvia
-
 Lebanon
-
 Lesotho
-
 Libya
Libya
-
 Lithuania
-
 Luxembourg
-
 Madagascar
-
 Malaysia
-
 Malta
Malta
-
 Mauritius
-
 Mexico
-
 Moldova
-
 Mongolia
-
 Montenegro
-
 Morocco
-
 Mozambique
-
 Myanmar
-
 Namibia
-
 Nepal
Nepal
-
 Netherlands
-
 New Zealand
-
 Nigeria
-
 North Macedonia
-
 Norway
-
 Oman
Oman
-
 Pakistan
-
 Palestine
-
 Panama
-
 Papua New Guinea
-
 Paraguay
-
 Peru
Peru
-
 Philippines
-
 Poland
-
 Portugal
-
 Puerto Rico
-
 Qatar
Qatar
-
 Reunion
-
 Romania
-
 Rwanda
-
 Saudi Arabia
-
 Serbia
-
 Singapore
-
 Slovakia
-
 Slovenia
-
 Somalia
-
 South Africa
-
 Spain
Spain
-
 Sri Lanka
-
 Sweden
-
 Switzerland
-
 Syria
Syria
-
 Taiwan
-
 Tajikistan
-
 Tanzania
-
 Thailand
-
 Trinidad and Tobago
-
 Tunisia
-
 Turkey
-
 UAE
UAE
-
 Uganda
-
 Ukraine
-
 United Kingdom
-
United States
-
 Uruguay
-
 Uzbekistan
-
 Venezuela
-
 Vietnam
-
 Yemen
Yemen
-
 Zambia
-
 Zimbabwe
- Forex
- Crypto












