


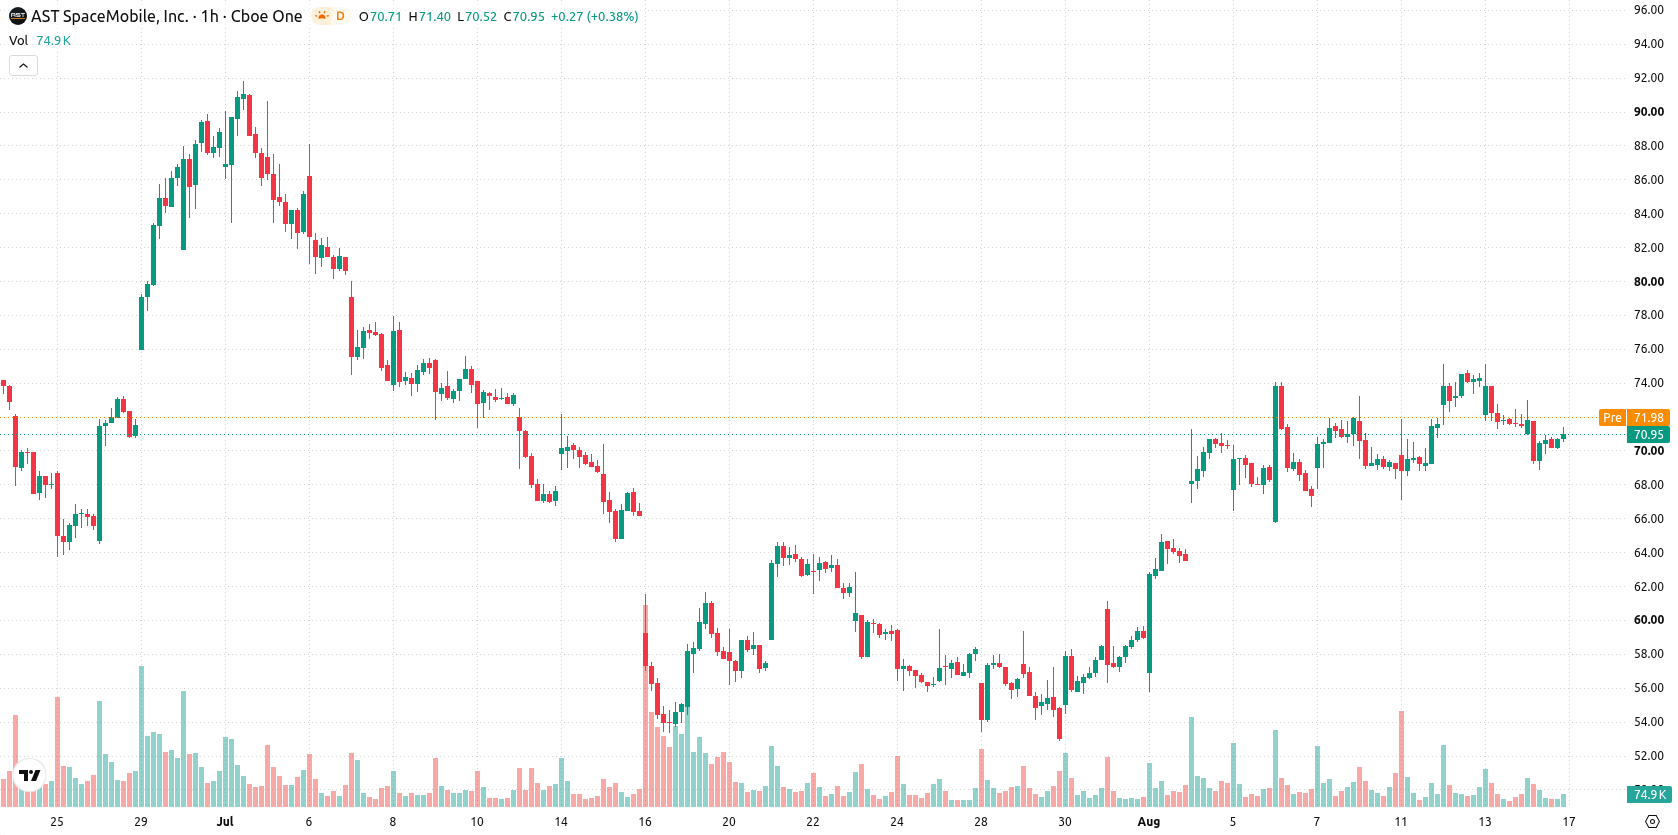
AST SpaceMobile (ASTS) stock is trading at $70.98, registering a marginal daily decline. The price currently sits below its key short-term moving averages but remains above medium-term levels.
 29.16
36.90
Highlights
- ASTS/USD trades below key short- and long-term moving averages, showing continued downside pressure with some medium-term support.
- Momentum and oscillator signals are mixed overall, with hints of mild bearish bias and no clear oversold condition.
- Price is expected to fluctuate between $67.40 and $74.56 over the next 2 to 3 days, with a 68% probability of upside.
Mixed signals as intraday volatility collides with long-term risk
On the hourly chart, support is observed at MA-50 ($70.87), while resistance is present at MA-20 ($72.09) and the Ichimoku Kijun level ($71.92). The daily timeframe places the price well below MA-200 ($81.89), illustrating long-term downside risk. Among momentum indicators, the MACD is Neutral, ADX signals Buy, while RSI at 48.82, CCI, and Bull/Bear Power all provide bearish or oversold signals; Stoch RSI and Awesome Oscillator are Neutral. Together, this mix indicates strong intraday volatility, conflicting trend signals, and general uncertainty.
Upside bias as breakout and support levels define risk
For the next 2–3 days, ASTS is expected to fluctuate within a volatility band from $67.40 to $74.56. The probability of an upward move is calculated at 68%, with a 32% chance of downside. A sustained break above $71.92 could open further gains, whereas a fall below $67.40 would signal additional weakness.
Earlier, analysts noted that AST SpaceMobile faced continued downside pressure and ambiguous technical signals, with persistent concerns regarding profitability and overall trend direction. The current multi-timeframe indicator mix and heightened volatility reinforce the theme of uncertainty, making the $71.92 resistance and $67.40 support critical levels to monitor for an emerging directional move in the days ahead.






Latest AST SpaceMobile News



-
 Afghanistan
-
 Albania
-
 Algeria
-
 Angola
-
 Argentina
-
 Armenia
-
 Australia
-
 Austria
-
 Azerbaijan
-
 Bahamas
-
 Bahrain
-
 Bangladesh
-
 Belarus
-
 Belgium
-
 Bolivia
-
 Botswana
-
 Brazil
-
 Brunei
-
 Bulgaria
-
 Cambodia
-
 Cameroon
-
 Canada
-
 Chile
-
 China
-
 Colombia
-
 Congo
-
 Costa Rica
-
 Cote d'Ivoire
-
 Croatia
-
 Cuba
-
 Cyprus
-
 Czechia
-
 DR Congo
-
 Denmark
-
 Dominican Republic
-
 Ecuador
-
 Egypt
-
 El Salvador
-
 Estonia
-
 Eswatini
-
 Ethiopia
-
 Finland
-
 France
-
 Georgia
-
 Germany
-
 Ghana
-
 Greece
-
 Haiti
-
 Hong Kong
-
 Hungary
-
 India
-
 Indonesia
-
 Iran, Islamic republic
-
 Iraq
-
 Ireland
-
 Israel
-
 Italy
-
 Jamaica
-
 Japan
-
 Jordan
-
 Kazakhstan
-
 Kenya
-
 Korea
-
 Kuwait
-
 Kyrgyzstan
-
 Laos
-
 Latvia
-
 Lebanon
-
 Lesotho
-
 Libya
-
 Lithuania
-
 Luxembourg
-
 Madagascar
-
 Malaysia
-
 Malta
-
 Mauritius
-
 Mexico
-
 Moldova
-
 Mongolia
-
 Montenegro
-
 Morocco
-
 Mozambique
-
 Myanmar
-
 Namibia
-
 Nepal
-
 Netherlands
-
 New Zealand
-
 Nigeria
-
 North Macedonia
-
 Norway
-
 Oman
-
 Pakistan
-
 Palestine
-
 Panama
-
 Papua New Guinea
-
 Paraguay
-
 Peru
-
 Philippines
-
 Poland
-
 Portugal
-
 Puerto Rico
-
 Qatar
-
 Reunion
-
 Romania
-
 Rwanda
-
 Saudi Arabia
-
 Serbia
-
 Singapore
-
 Slovakia
-
 Slovenia
-
 Somalia
-
 South Africa
-
 Spain
-
 Sri Lanka
-
 Sweden
-
 Switzerland
-
 Syria
-
 Taiwan
-
 Tajikistan
-
 Tanzania
-
 Thailand
-
 Trinidad and Tobago
-
 Tunisia
-
 Turkey
-
 UAE
-
 Uganda
-
 Ukraine
-
 United Kingdom
-
United States
-
 Uruguay
-
 Uzbekistan
-
 Venezuela
-
 Vietnam
-
 Yemen
-
 Zambia
-
 Zimbabwe
- Forex
- Crypto












