

Flex shares gain more than 3% after bullish technical signals, no fresh news

Flex Ltd. (FLEX) surged 3.08% as technical momentum and strong intraday buying fueled a sharp move higher, lacking a fresh catalyst from news flow. The advance is supported by price holding above the 20-day and 200-day moving averages, but upside looks limited with resistance persisting below the 50-day average and key technical divergence present.
 89.69
95.07
Highlights
- Flex stock trades above its 20-day and 200-day moving averages but faces medium-term resistance below the 50-day average.
- Technical indicators are mixed, with most oscillators overbought and buyer-dominated, but key momentum signals lagging.
- Flex stock is expected to consolidate between $125.01 and $135.07 over the next five days, with a 71% probability of an upward move.
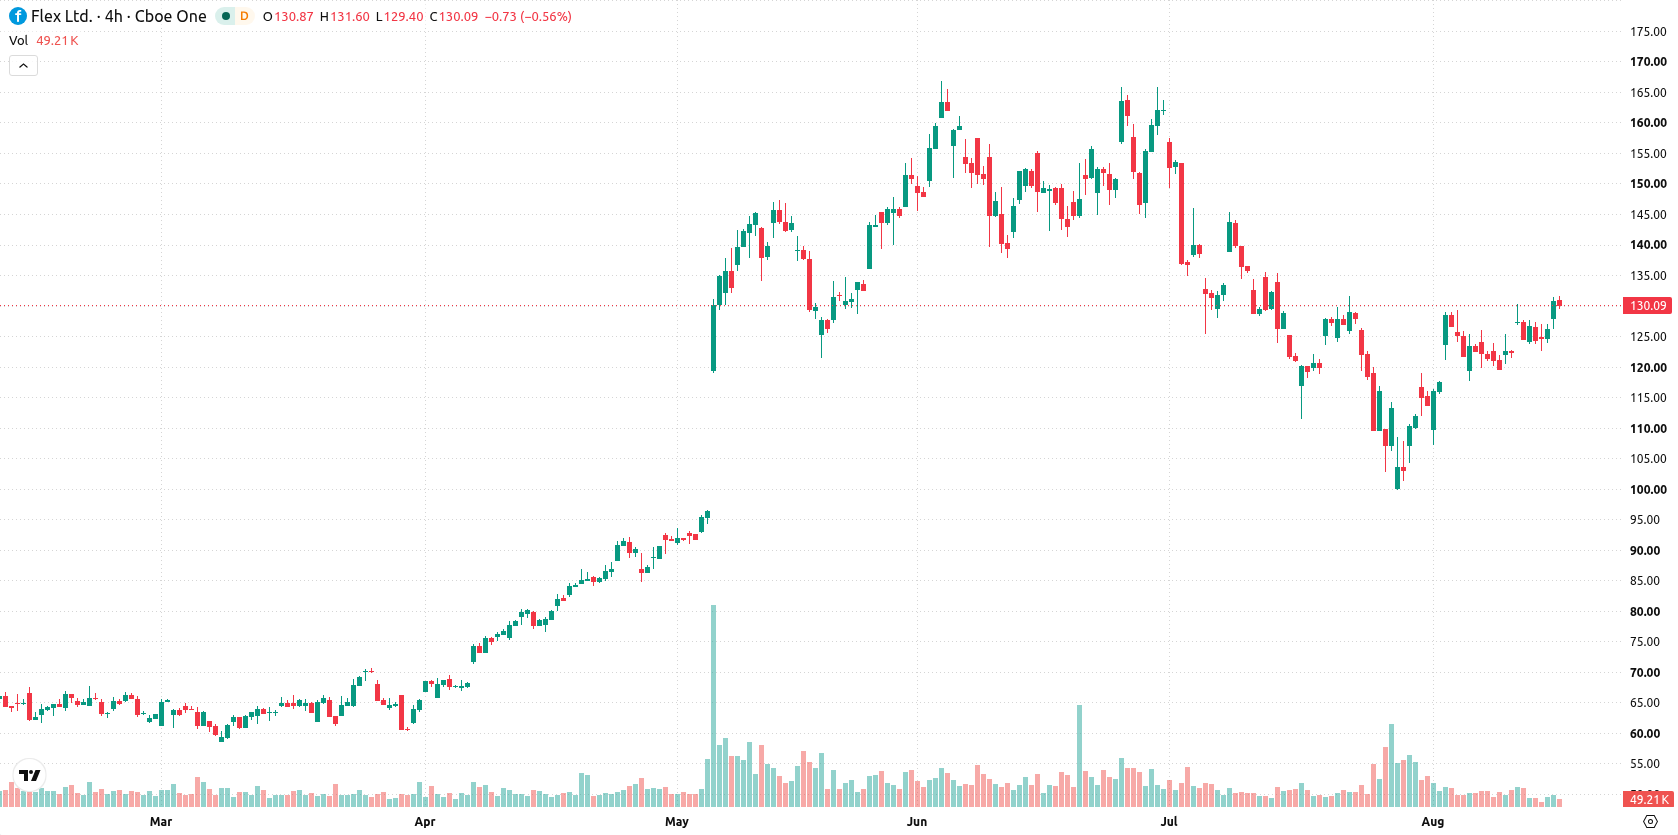
Bullish pressure persists as resistance and overbought signals emerge
Flex is trading above its 20-day and 200-day moving averages at $120.3 and $91.15, but remains below the 50-day average at $134.64. This setup signals near-term bullish pressure, medium-term resistance, and confirms a positive long-term trend, with the $130.38 week high as resistance and the $126.36 session low as the closest support. Momentum indicators are mixed: MACD remains bearish and ADX is neutral, while RSI, CCI, and BBP signal buyer dominance. Both BBP and Stochastic RSI show overbought conditions. Intraday volatility stands at 4.15%, with the stock near session highs after a clear upside gap of 1.62%. There is continued bullish intraday momentum, although divergence between overbought oscillators and lagging momentum indicators stands out.
Earlier, analysts noted that sudden price and volume surges in listed stocks often prompt clarification processes or increased scrutiny to ensure transparency for investors. As Flex now encounters technical divergence amid strong intraday buying, traders should closely monitor the $130.38 resistance, as a breakout could signal renewed momentum within the current volatility band.






Latest Flex Ltd News




-
 Afghanistan
-
 Albania
-
 Algeria
-
 Angola
-
 Argentina
-
 Armenia
-
 Australia
-
 Austria
-
 Azerbaijan
-
 Bahamas
-
 Bahrain
-
 Bangladesh
-
 Belarus
-
 Belgium
-
 Bolivia
-
 Botswana
-
 Brazil
-
 Brunei
-
 Bulgaria
-
 Cambodia
-
 Cameroon
-
 Canada
-
 Chile
-
 China
-
 Colombia
-
 Congo
-
 Costa Rica
-
 Cote d'Ivoire
-
 Croatia
-
 Cuba
-
 Cyprus
-
 Czechia
-
 DR Congo
-
 Denmark
-
 Dominican Republic
-
 Ecuador
-
 Egypt
-
 El Salvador
-
 Estonia
-
 Eswatini
-
 Ethiopia
-
 Finland
-
 France
-
 Georgia
-
 Germany
-
 Ghana
-
 Greece
-
 Haiti
-
 Hong Kong
-
 Hungary
-
 India
-
 Indonesia
-
 Iran, Islamic republic
-
 Iraq
-
 Ireland
-
 Israel
-
 Italy
-
 Jamaica
-
 Japan
-
 Jordan
-
 Kazakhstan
-
 Kenya
-
 Korea
-
 Kuwait
-
 Kyrgyzstan
-
 Laos
-
 Latvia
-
 Lebanon
-
 Lesotho
-
 Libya
-
 Lithuania
-
 Luxembourg
-
 Madagascar
-
 Malaysia
-
 Malta
-
 Mauritius
-
 Mexico
-
 Moldova
-
 Mongolia
-
 Montenegro
-
 Morocco
-
 Mozambique
-
 Myanmar
-
 Namibia
-
 Nepal
-
 Netherlands
-
 New Zealand
-
 Nigeria
-
 North Macedonia
-
 Norway
-
 Oman
-
 Pakistan
-
 Palestine
-
 Panama
-
 Papua New Guinea
-
 Paraguay
-
 Peru
-
 Philippines
-
 Poland
-
 Portugal
-
 Puerto Rico
-
 Qatar
-
 Reunion
-
 Romania
-
 Rwanda
-
 Saudi Arabia
-
 Serbia
-
 Singapore
-
 Slovakia
-
 Slovenia
-
 Somalia
-
 South Africa
-
 Spain
-
 Sri Lanka
-
 Sweden
-
 Switzerland
-
 Syria
-
 Taiwan
-
 Tajikistan
-
 Tanzania
-
 Thailand
-
 Trinidad and Tobago
-
 Tunisia
-
 Turkey
-
 UAE
-
 Uganda
-
 Ukraine
-
 United Kingdom
-
United States
-
 Uruguay
-
 Uzbekistan
-
 Venezuela
-
 Vietnam
-
 Yemen
-
 Zambia
-
 Zimbabwe
- Forex
- Crypto












