


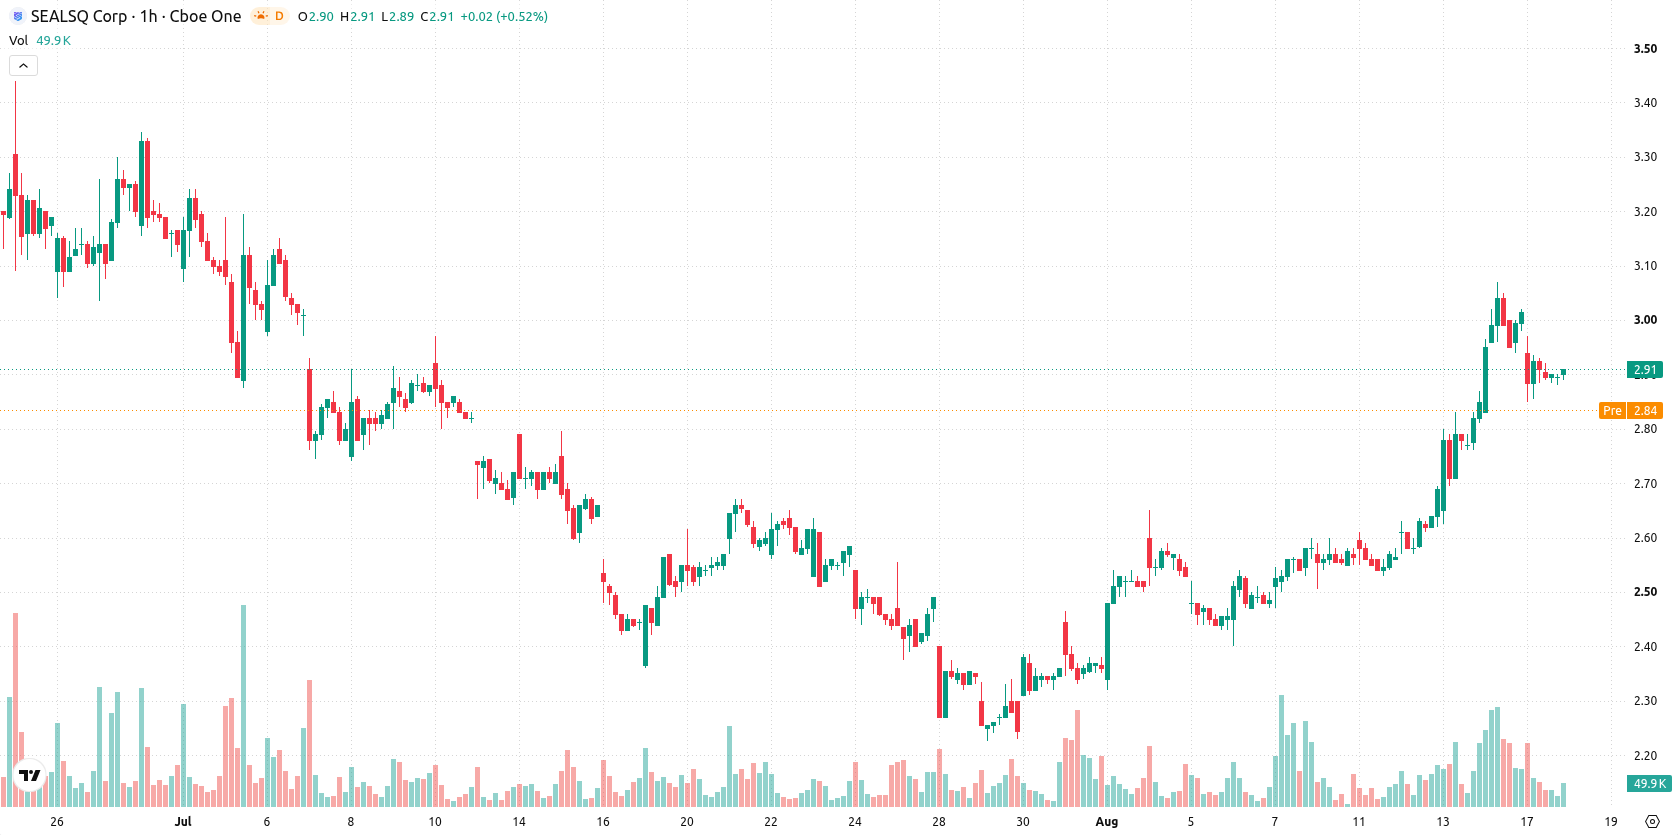
SEALSQ (LAES) stock is trading at $2.9, down 3.65% on the day with a small downward gap and high volatility, currently positioned mid-range for the session. The price remains above its key moving averages over the short and medium term, but below the longer-term trend indicator.
 1.98
2.37
1.98
2.37
Highlights
- LAES/USD trades above short- and medium-term moving averages but remains below the long-term moving average, indicating a bullish short-term trend with a bearish long-term bias.
- Momentum indicators collectively suggest robust upside potential, with most signals supporting further gains and only isolated oscillators showing mixed signals.
- The expected trading range for the next sessions is $2.66 to $3.14, with a higher likelihood of upward moves if resistance at $3.14 breaks and risk to the downside if support at $2.82 fails.
Mixed oscillator signals amid underlying bullish momentum
The nearest technical support sits at the Ichimoku Kijun level of $2.82. On the daily chart, LAES trades above its MA-20 and MA-50, while remaining below the MA-200. Momentum indicators show MACD in a strong buy position and ADX in buy territory, pointing to ongoing upside pressure. RSI also indicates a buy, with Stoch RSI currently oversold and CCI reading as neutral. Bull/Bear Power reflects intraday buyer dominance; however, the Awesome Oscillator does not confirm the prevailing trend direction. Overall, oscillator signals are mixed, yet underlying momentum is still positive.
Sideways outlook as resistance caps upside potential
In the short term, the expected trading range for LAES is $2.66 to $3.14, representing a typical volatility band relative to current levels. The most likely near-term scenario is continued sideways movement within this range. A pronounced bullish move would require a breakout above $3.14 resistance, while a shift below immediate support at $2.82 could open the way toward the lower bound. Although the probability of an upside move remains high, downside risk appears limited barring a breakdown of current support.
Earlier, analysts noted that SEALSQ was exhibiting near-term bullish momentum while cautioning about overbought technical conditions and increased volatility. The latest analysis adds depth by highlighting a mix of momentum and oscillator signals, with traders advised to monitor the $2.82 support level for any potential shift in downside risk.










-
 Afghanistan
-
 Albania
-
 Algeria
-
 Angola
-
 Argentina
-
 Armenia
-
 Australia
-
 Austria
-
 Azerbaijan
-
 Bahamas
-
 Bahrain
-
 Bangladesh
-
 Belarus
-
 Belgium
-
 Bolivia
-
 Botswana
-
 Brazil
-
 Brunei
-
 Bulgaria
-
 Cambodia
-
 Cameroon
-
 Canada
-
 Chile
Chile
-
 China
China
-
 Colombia
-
 Congo
Congo
-
 Costa Rica
-
 Cote d'Ivoire
-
 Croatia
-
 Cuba
Cuba
-
 Cyprus
-
 Czechia
-
 DR Congo
-
 Denmark
-
 Dominican Republic
-
 Ecuador
-
 Egypt
Egypt
-
 El Salvador
-
 Estonia
-
 Eswatini
-
 Ethiopia
-
 Finland
-
 France
-
 Georgia
-
 Germany
-
 Ghana
Ghana
-
 Greece
-
 Haiti
Haiti
-
 Hong Kong
-
 Hungary
-
 India
India
-
 Indonesia
-
 Iran, Islamic republic
-
 Iraq
Iraq
-
 Ireland
-
 Israel
-
 Italy
Italy
-
 Jamaica
-
 Japan
Japan
-
 Jordan
-
 Kazakhstan
-
 Kenya
Kenya
-
 Korea
Korea
-
 Kuwait
-
 Kyrgyzstan
-
 Laos
Laos
-
 Latvia
-
 Lebanon
-
 Lesotho
-
 Libya
Libya
-
 Lithuania
-
 Luxembourg
-
 Madagascar
-
 Malaysia
-
 Malta
Malta
-
 Mauritius
-
 Mexico
-
 Moldova
-
 Mongolia
-
 Montenegro
-
 Morocco
-
 Mozambique
-
 Myanmar
-
 Namibia
-
 Nepal
Nepal
-
 Netherlands
-
 New Zealand
-
 Nigeria
-
 North Macedonia
-
 Norway
-
 Oman
Oman
-
 Pakistan
-
 Palestine
-
 Panama
-
 Papua New Guinea
-
 Paraguay
-
 Peru
Peru
-
 Philippines
-
 Poland
-
 Portugal
-
 Puerto Rico
-
 Qatar
Qatar
-
 Reunion
-
 Romania
-
 Rwanda
-
 Saudi Arabia
-
 Serbia
-
 Singapore
-
 Slovakia
-
 Slovenia
-
 Somalia
-
 South Africa
-
 Spain
Spain
-
 Sri Lanka
-
 Sweden
-
 Switzerland
-
 Syria
Syria
-
 Taiwan
-
 Tajikistan
-
 Tanzania
-
 Thailand
-
 Trinidad and Tobago
-
 Tunisia
-
 Turkey
-
 UAE
UAE
-
 Uganda
-
 Ukraine
-
 United Kingdom
-
United States
-
 Uruguay
-
 Uzbekistan
-
 Venezuela
-
 Vietnam
-
 Yemen
Yemen
-
 Zambia
-
 Zimbabwe
- Forex
- Crypto












