

Why is AST SpaceMobile stock flat today? BlueBird 7 satellite write-off and support levels to watch

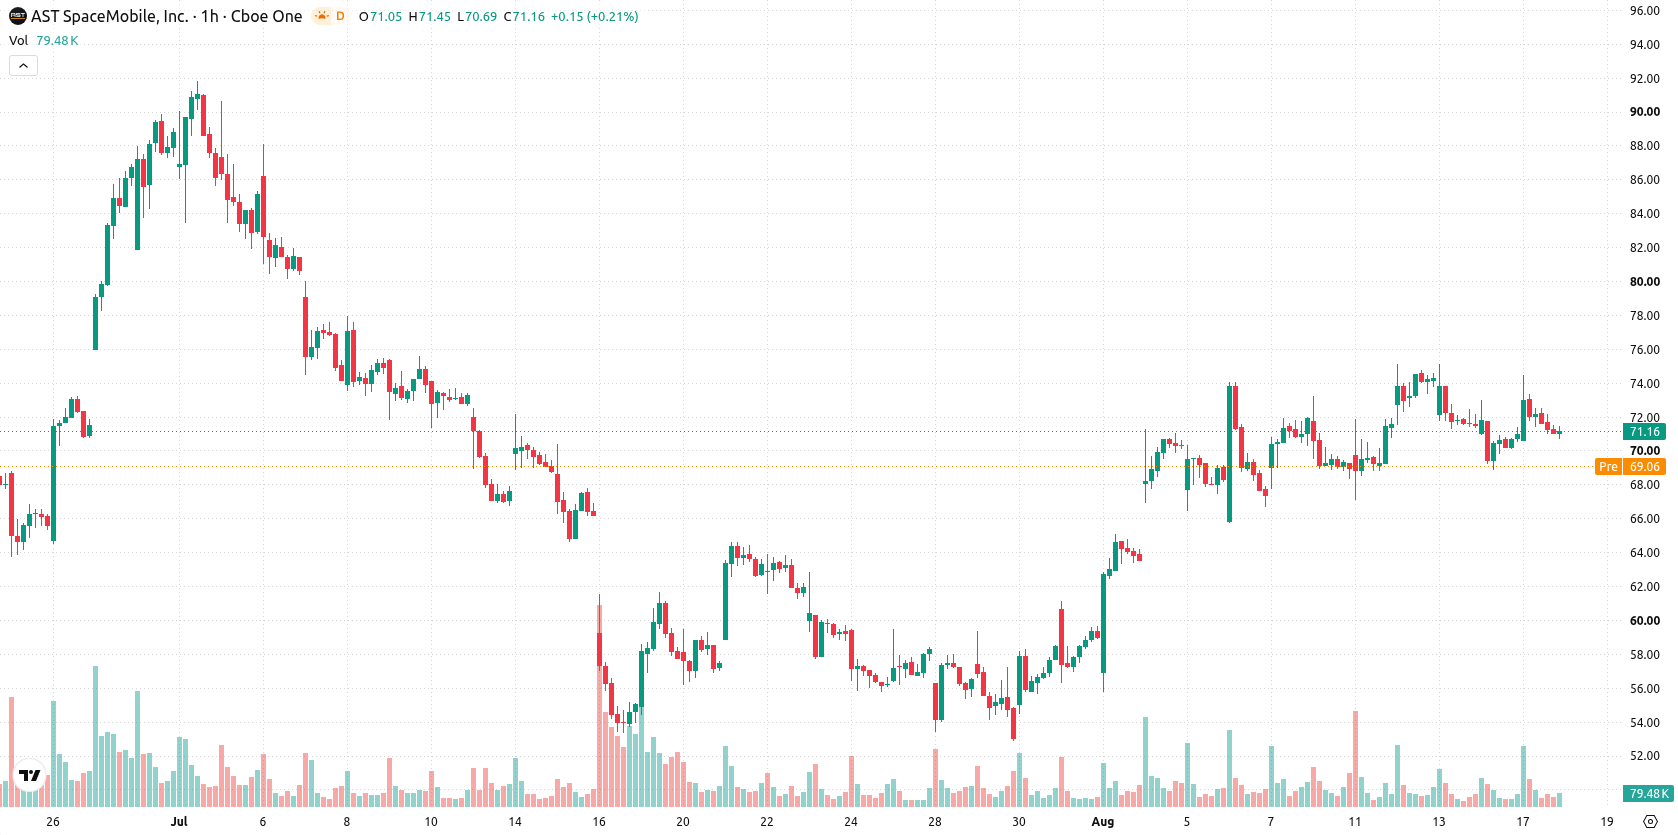
AST SpaceMobile (ASTS) stock is trading at $71.14, showing a modest increase for the session. The price remains below its primary moving averages, reflecting lingering downward pressure during a volatile day.
 28.10
36.33
Highlights
- AST SpaceMobile reported second-quarter 2026 revenue of $31.52 million, more than doubling from the prior quarter but missing analyst estimates.
- The company boosted cash reserves above $3.7 billion through a convertible debt offering and recorded a $125.9 million write-off from the BlueBird 7 satellite loss.
- Shares of AST SpaceMobile trade below key moving averages, with downside momentum prevailing and the price projected to move between $67.56 and $74.72 in the coming days.
Revenue growth and satellite loss drive liquidity buildup, volatility
AST SpaceMobile delivered second-quarter 2026 revenue of $31.52 million, a figure that doubled from the previous quarter but still fell short of analyst expectations, according to Benzinga. The company has substantially increased its cash reserves to over $3.7 billion through a convertible debt offering, providing strong liquidity for future operations. Additional developments include expanded satellite production capacity in Texas and three new U.S. commercial gateway agreements, which expand the business's addressable market, while the $125.9 million write-off from the BlueBird 7 satellite loss directly impacted quarterly earnings. Together, these actions highlight a period of rapid operational scaling alongside continued financial volatility and growth investment.
Technical resistance and strong sell signals amid persistent downside
On the hourly chart, ASTS is trading below the MA-20, MA-50, and the long-term MA-200, demonstrating prevailing downside pressure. The Ichimoku Kijun at $71.95 acts as immediate resistance for any rebound attempts. MACD signals remain Neutral, while ADX has switched to Buy, showing divergence in trend strength. RSI stands at 48.54, indicating a Sell, with both Stochastic RSI and CCI printing Neutral readings. Bull/Bear Power is Oversold, favoring sellers, and the Awesome Oscillator issues a Strong Sell, confirming continued downside momentum. The price opened the session with a minor gap down and is currently near the day's low amid heightened volatility.
Rangebound trading likely as volatility tightens directional odds
Over the next few days, ASTS is expected to trade within a range of $67.56 to $74.72, reflecting its recent volatility band. The baseline scenario is renewed sideways movement inside this zone, with a 53% probability for an upward move and a 47% chance of a decline. A bullish breakout scenario would require a close above $71.95, which could open room toward the upper bound, while a move below the $67.56 support would signal a continuation of the current downward bias.
Earlier, analysts noted that AST SpaceMobile was experiencing ambiguous technical signals alongside ongoing downside trend pressure. The current update adds evidence of persistent volatility and financial turnover, with the immediate focus on whether the stock can reclaim resistance at $71.95 to shift the outlook from consolidation to recovery.






Latest AST SpaceMobile News



-
 Afghanistan
-
 Albania
-
 Algeria
-
 Angola
-
 Argentina
-
 Armenia
-
 Australia
-
 Austria
-
 Azerbaijan
-
 Bahamas
-
 Bahrain
-
 Bangladesh
-
 Belarus
-
 Belgium
-
 Bolivia
-
 Botswana
-
 Brazil
-
 Brunei
-
 Bulgaria
-
 Cambodia
-
 Cameroon
-
 Canada
-
 Chile
-
 China
-
 Colombia
-
 Congo
-
 Costa Rica
-
 Cote d'Ivoire
-
 Croatia
-
 Cuba
-
 Cyprus
-
 Czechia
-
 DR Congo
-
 Denmark
-
 Dominican Republic
-
 Ecuador
-
 Egypt
-
 El Salvador
-
 Estonia
-
 Eswatini
-
 Ethiopia
-
 Finland
-
 France
-
 Georgia
-
 Germany
-
 Ghana
-
 Greece
-
 Haiti
-
 Hong Kong
-
 Hungary
-
 India
-
 Indonesia
-
 Iran, Islamic republic
-
 Iraq
-
 Ireland
-
 Israel
-
 Italy
-
 Jamaica
-
 Japan
-
 Jordan
-
 Kazakhstan
-
 Kenya
-
 Korea
-
 Kuwait
-
 Kyrgyzstan
-
 Laos
-
 Latvia
-
 Lebanon
-
 Lesotho
-
 Libya
-
 Lithuania
-
 Luxembourg
-
 Madagascar
-
 Malaysia
-
 Malta
-
 Mauritius
-
 Mexico
-
 Moldova
-
 Mongolia
-
 Montenegro
-
 Morocco
-
 Mozambique
-
 Myanmar
-
 Namibia
-
 Nepal
-
 Netherlands
-
 New Zealand
-
 Nigeria
-
 North Macedonia
-
 Norway
-
 Oman
-
 Pakistan
-
 Palestine
-
 Panama
-
 Papua New Guinea
-
 Paraguay
-
 Peru
-
 Philippines
-
 Poland
-
 Portugal
-
 Puerto Rico
-
 Qatar
-
 Reunion
-
 Romania
-
 Rwanda
-
 Saudi Arabia
-
 Serbia
-
 Singapore
-
 Slovakia
-
 Slovenia
-
 Somalia
-
 South Africa
-
 Spain
-
 Sri Lanka
-
 Sweden
-
 Switzerland
-
 Syria
-
 Taiwan
-
 Tajikistan
-
 Tanzania
-
 Thailand
-
 Trinidad and Tobago
-
 Tunisia
-
 Turkey
-
 UAE
-
 Uganda
-
 Ukraine
-
 United Kingdom
-
United States
-
 Uruguay
-
 Uzbekistan
-
 Venezuela
-
 Vietnam
-
 Yemen
-
 Zambia
-
 Zimbabwe
- Forex
- Crypto












