

Mastercard stock weekly forecast: Gains hold as price approaches resistance at recent highs

Shares of Mastercard Inc (MA) are trading near $571 as the stock extends its recovery but enters the week facing overbought conditions. Despite steady support holding, signals of exhaustion suggest gains could slow in the coming days as technical and news drivers converge.
 661.26
Highlights
- Shares of Mastercard ended the week at $571.14, edging higher and maintaining a bullish long-term structure.
- Momentum signals are mixed, with strong underlying trend but indicators suggest near-term exhaustion at current levels.
- Over the coming week, Mastercard stock is expected to consolidate or see modest gains between $556.71 and $577.64, with 64% probability of an increase.
Service revenue surge and partnerships propel bullish sentiment this week
Mastercard reported a sharp increase in services revenue, with growth in cybersecurity, authentication, and customer-engagement products notably outpacing its traditional payment network, according to Yahoo Finance. The company also continued its focus on capital returns, completing $4.9 billion in share repurchases and paying $771 million in dividends this quarter, with a sizable $7.8 billion buyback authorization still active through July 27, 2026. Additional momentum comes from expanding partnerships, such as the recent deal with Fiserv and a cross-border stablecoin payments pilot, as noted by Simply Wall St.
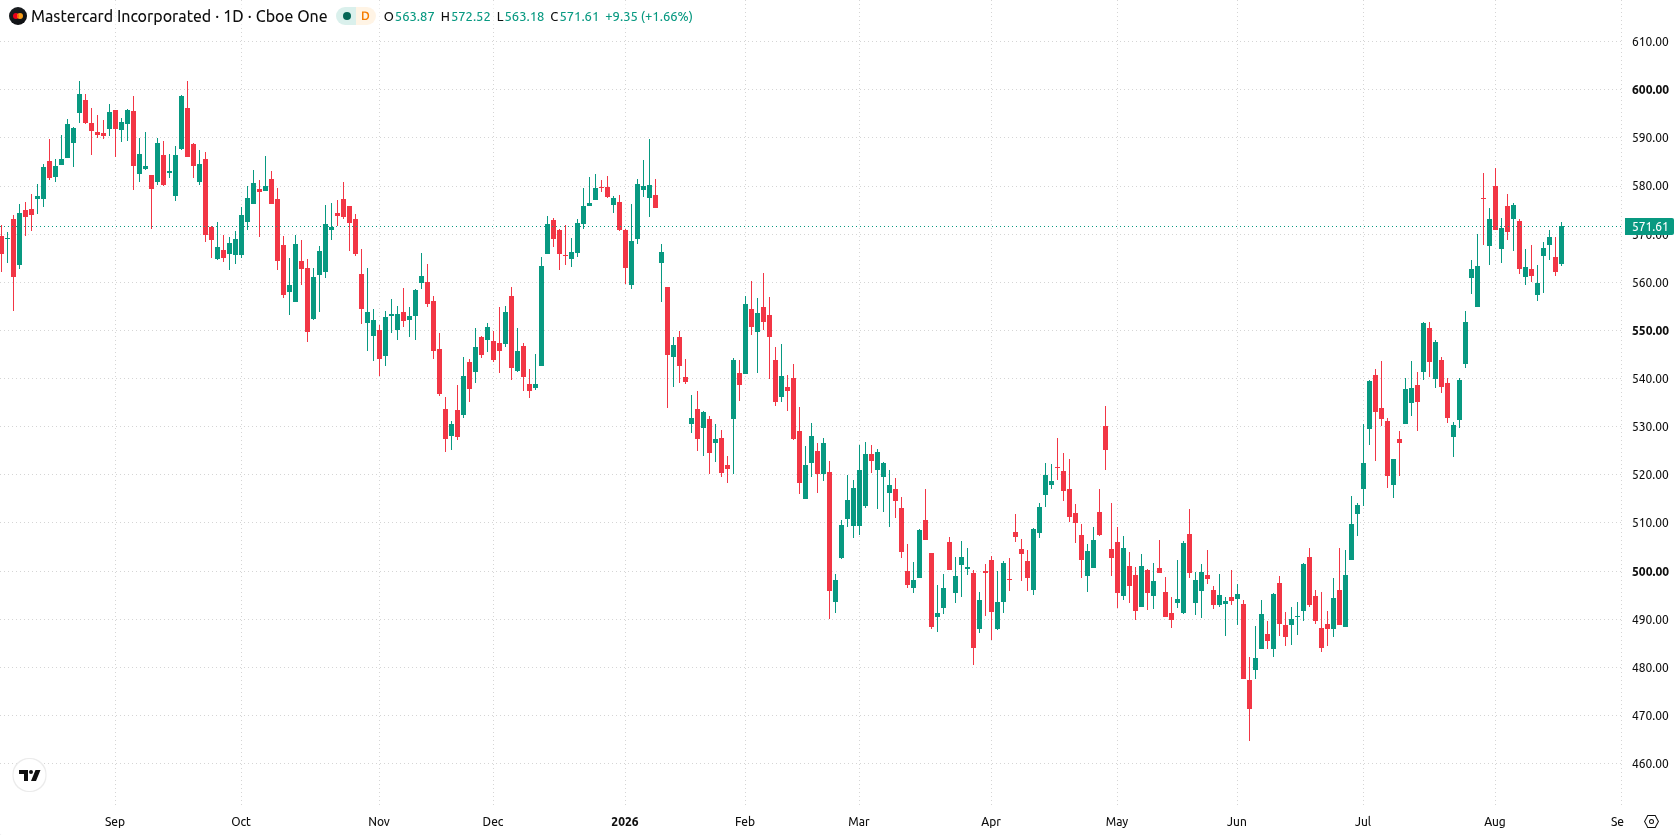
Sustained upside momentum meets resistance as technical exhaustion increases
On the daily chart, Mastercard stock has staged a sustained move higher with a firm trend, with volatility at 2.62%. Momentum signals show a mixed picture: the MACD is strongly bullish at 10.44, while Stochastic RSI is in the oversold zone, highlighting a divergence between strong underlying momentum and near-term exhaustion signals. Immediate support sits essentially at the current level, $570.61, while $553.66 (Ichimoku Kijun) serves as a deeper support area. With price pinned to resistance at the top of the weekly range, gains may be slow to extend without fresh buying pressure.
Consolidation expected with breakout risk as Mastercard holds key support
Over the coming trading week, Mastercard is expected to trade between $556.71 and $577.64. The probability of an increase is 64%, while the probability of a decrease is 36%. The base case is continued consolidation or modest gains above $570.61 support. A push above $577.64 would signal fresh bullish momentum, while a drop below $556.71 risks deeper mean reversion toward the $553.66 area.
Previously it was reported that Bill Ackman added Mastercard to his Pershing Square funds as part of a significant portfolio reshaping, citing strong earnings growth potential among key drivers. With Mastercard now exhibiting a sustained uptrend but facing signs of near-term exhaustion, traders should monitor for either a breakout above current resistance to confirm renewed bullish momentum or a pullback toward deeper support near $553.66 as the next actionable level.











-
 Afghanistan
-
 Albania
-
 Algeria
-
 Angola
-
 Argentina
-
 Armenia
-
 Australia
-
 Austria
-
 Azerbaijan
-
 Bahamas
-
 Bahrain
-
 Bangladesh
-
 Belarus
-
 Belgium
-
 Bolivia
-
 Botswana
-
 Brazil
-
 Brunei
-
 Bulgaria
-
 Cambodia
-
 Cameroon
-
 Canada
-
 Chile
-
 China
-
 Colombia
-
 Congo
-
 Costa Rica
-
 Cote d'Ivoire
-
 Croatia
-
 Cuba
-
 Cyprus
-
 Czechia
-
 DR Congo
-
 Denmark
-
 Dominican Republic
-
 Ecuador
-
 Egypt
-
 El Salvador
-
 Estonia
-
 Eswatini
-
 Ethiopia
-
 Finland
-
 France
-
 Georgia
-
 Germany
-
 Ghana
-
 Greece
-
 Haiti
-
 Hong Kong
-
 Hungary
-
 India
-
 Indonesia
-
 Iran, Islamic republic
-
 Iraq
-
 Ireland
-
 Israel
-
 Italy
-
 Jamaica
-
 Japan
-
 Jordan
-
 Kazakhstan
-
 Kenya
-
 Korea
-
 Kuwait
-
 Kyrgyzstan
-
 Laos
-
 Latvia
-
 Lebanon
-
 Lesotho
-
 Libya
-
 Lithuania
-
 Luxembourg
-
 Madagascar
-
 Malaysia
-
 Malta
-
 Mauritius
-
 Mexico
-
 Moldova
-
 Mongolia
-
 Montenegro
-
 Morocco
-
 Mozambique
-
 Myanmar
-
 Namibia
-
 Nepal
-
 Netherlands
-
 New Zealand
-
 Nigeria
-
 North Macedonia
-
 Norway
-
 Oman
-
 Pakistan
-
 Palestine
-
 Panama
-
 Papua New Guinea
-
 Paraguay
-
 Peru
-
 Philippines
-
 Poland
-
 Portugal
-
 Puerto Rico
-
 Qatar
-
 Reunion
-
 Romania
-
 Rwanda
-
 Saudi Arabia
-
 Serbia
-
 Singapore
-
 Slovakia
-
 Slovenia
-
 Somalia
-
 South Africa
-
 Spain
-
 Sri Lanka
-
 Sweden
-
 Switzerland
-
 Syria
-
 Taiwan
-
 Tajikistan
-
 Tanzania
-
 Thailand
-
 Trinidad and Tobago
-
 Tunisia
-
 Turkey
-
 UAE
-
 Uganda
-
 Ukraine
-
 United Kingdom
-
United States
-
 Uruguay
-
 Uzbekistan
-
 Venezuela
-
 Vietnam
-
 Yemen
-
 Zambia
-
 Zimbabwe
- Forex
- Crypto












