

PATH slides over 3% as technical indicators show mixed momentum following bearish session

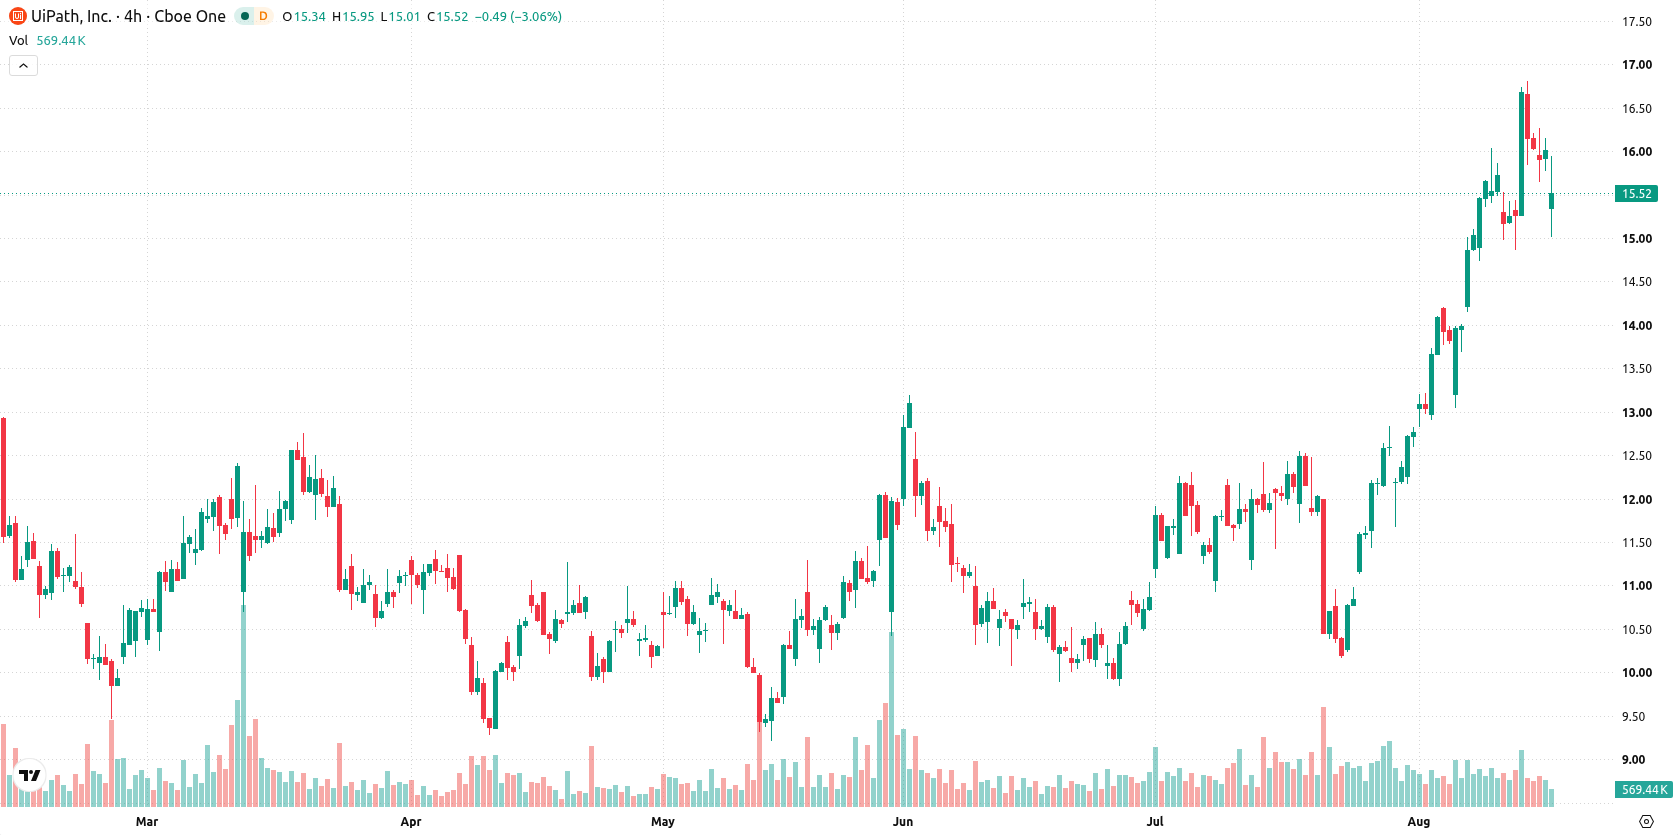
UiPath Inc (PATH) slid 3.13% after selling momentum overshadowed any fresh catalysts, as downside pressure emerged from the open. The move faces limits with the stock trading above key moving averages, signaling resilience despite the bearish session.
 13.10
13.81
Highlights
- UiPath stock trades in a short-term uptrend above key moving averages, with medium- and long-term momentum showing mixed signals.
- Momentum indicators show ongoing buying interest but flag overbought conditions and a weak trend, with recent consolidation after an initial drop.
- Shares are expected to trade between $14.55 and $16.43 over the next five days, with 76% probability of an upward move.
Mixed momentum as stock holds above major moving averages
UiPath is trading above the 20-day, 50-day, and 200-day moving averages ($13.53, $12.08, and $12.73, respectively), reflecting a short-term uptrend backed by medium- and long-term strength. Short-term support is seen at $15.13 with near-term resistance at the session high of $15.88. The alignment of the 50-day versus the 200-day moving average remains bearish, signaling a cautious broader trend. Momentum signals show a mixed picture: MACD points to ongoing buying interest, yet the ADX at 18.09 signals a weak trend. The RSI is elevated (69.41, Buy). The CCI and Bull/Bear Power both flag overbought conditions, with BBP confirming buyers still dominate intraday momentum. The Stochastic RSI and Awesome Oscillator suggest consolidation. Daily volatility stands at 4.96%. Intraday action has shifted to consolidation after initial downside pressure, with some divergence between brisk momentum and cooling oscillators.
Earlier, analysts noted that UiPath's ongoing profitability improvements and strong balance sheet were underpinning its bullish momentum, though technicals indicated elevated risk of a near-term pullback. The current analysis affirms this backdrop, highlighting that traders should monitor the $15.13–$16.43 volatility band for signals of a potential breakout or renewed consolidation in the days ahead.






Latest UiPath News




-
 Afghanistan
-
 Albania
-
 Algeria
-
 Angola
-
 Argentina
-
 Armenia
-
 Australia
-
 Austria
-
 Azerbaijan
-
 Bahamas
-
 Bahrain
-
 Bangladesh
-
 Belarus
-
 Belgium
-
 Bolivia
-
 Botswana
-
 Brazil
-
 Brunei
-
 Bulgaria
-
 Cambodia
-
 Cameroon
-
 Canada
-
 Chile
-
 China
-
 Colombia
-
 Congo
-
 Costa Rica
-
 Cote d'Ivoire
-
 Croatia
-
 Cuba
-
 Cyprus
-
 Czechia
-
 DR Congo
-
 Denmark
-
 Dominican Republic
-
 Ecuador
-
 Egypt
-
 El Salvador
-
 Estonia
-
 Eswatini
-
 Ethiopia
-
 Finland
-
 France
-
 Georgia
-
 Germany
-
 Ghana
-
 Greece
-
 Haiti
-
 Hong Kong
-
 Hungary
-
 India
-
 Indonesia
-
 Iran, Islamic republic
-
 Iraq
-
 Ireland
-
 Israel
-
 Italy
-
 Jamaica
-
 Japan
-
 Jordan
-
 Kazakhstan
-
 Kenya
-
 Korea
-
 Kuwait
-
 Kyrgyzstan
-
 Laos
-
 Latvia
-
 Lebanon
-
 Lesotho
-
 Libya
-
 Lithuania
-
 Luxembourg
-
 Madagascar
-
 Malaysia
-
 Malta
-
 Mauritius
-
 Mexico
-
 Moldova
-
 Mongolia
-
 Montenegro
-
 Morocco
-
 Mozambique
-
 Myanmar
-
 Namibia
-
 Nepal
-
 Netherlands
-
 New Zealand
-
 Nigeria
-
 North Macedonia
-
 Norway
-
 Oman
-
 Pakistan
-
 Palestine
-
 Panama
-
 Papua New Guinea
-
 Paraguay
-
 Peru
-
 Philippines
-
 Poland
-
 Portugal
-
 Puerto Rico
-
 Qatar
-
 Reunion
-
 Romania
-
 Rwanda
-
 Saudi Arabia
-
 Serbia
-
 Singapore
-
 Slovakia
-
 Slovenia
-
 Somalia
-
 South Africa
-
 Spain
-
 Sri Lanka
-
 Sweden
-
 Switzerland
-
 Syria
-
 Taiwan
-
 Tajikistan
-
 Tanzania
-
 Thailand
-
 Trinidad and Tobago
-
 Tunisia
-
 Turkey
-
 UAE
-
 Uganda
-
 Ukraine
-
 United Kingdom
-
United States
-
 Uruguay
-
 Uzbekistan
-
 Venezuela
-
 Vietnam
-
 Yemen
-
 Zambia
-
 Zimbabwe
- Forex
- Crypto












