

Interactive Brokers shares fall around 3.5% as technical signals drive sharp pullback

Interactive Brokers Group, Inc. (IBKR) fell 3.51% as a confluence of short-term seller pressure and divergent technical signals drove a sharp pullback. The decline is supported by a downside gap and mixed momentum readings that highlight bearish intraday sentiment despite the medium- to long-term bullish trend.
 89.11
91.81
89.11
91.81
Highlights
- Shares of Interactive Brokers are trading above their 20-day and 200-day moving averages but remain below the 50-day, indicating short-term seller pressure inside a broader uptrend.
- Technical indicators give mixed signals, with momentum readings neutral to bullish but several oscillators warn of overbought conditions and ongoing intraday buying.
- The five-day forecast range is $88.08 to $93.2, with a 79% chance of an upward move and key resistance at $91.37.
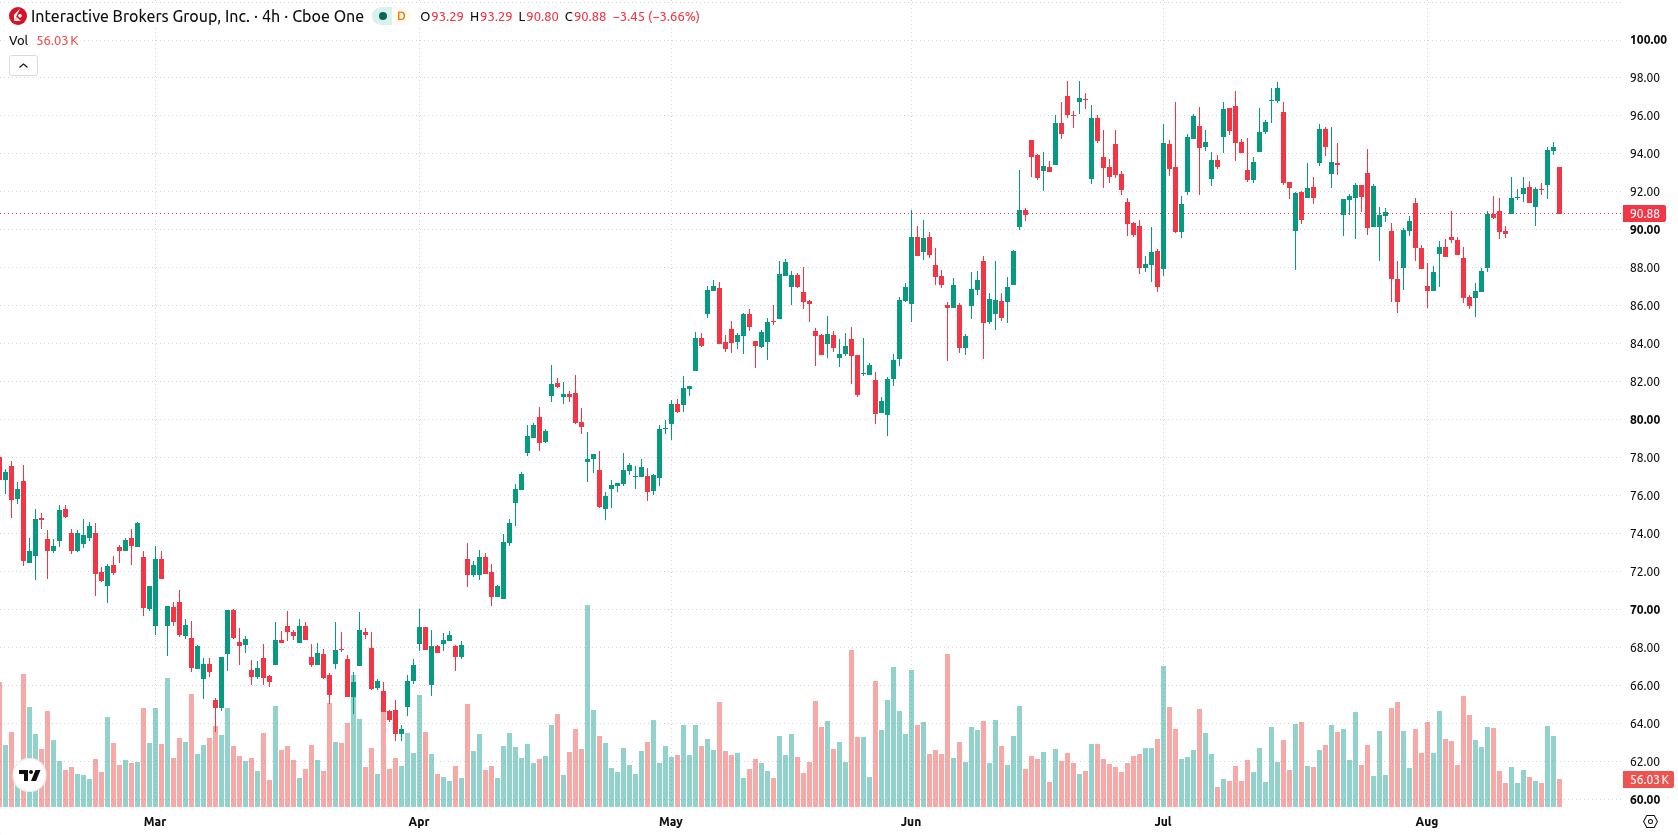
Overbought readings and price gap as bullish trend meets resistance
IBKR is trading above its 20-day moving average of $90.41 and well above the 200-day moving average of $77.23, but remains just below the 50-day moving average at $91.37. This positioning indicates lingering near-term seller pressure within an otherwise bullish medium- and long-term trend. Immediate resistance sits at $91.37, with near-term support at $90.9. Momentum signals are mixed: the MACD and ADX are neutral, the RSI stands at a constructive 58.15 (forecasting a buy), while several oscillators—Stochastic RSI, CCI, and BBP—show overbought conditions and BBP highlights strong intraday buying. The Awesome Oscillator points to ongoing underlying buy strength. The stock gapped down $1.32 and slid $3.31 to $91.02, closing near session lows as intraday volatility reached 2.32%. Overbought oscillators and late-session selling suggest a divergence between short-term bullish momentum and current price action.
Previously it was reported that two new companies, Molbio Diagnostics Limited and Dhoot Transmission Limited, would begin trading on India's NSE under the compulsory demat and rolling settlement system. While that event marked a notable market development, the current analysis of Interactive Brokers underscores the importance of monitoring the $91.37 resistance level in the coming sessions, as a breakout at this point could define the next directional move.





Latest Interactive Brokers News





-
 Afghanistan
-
 Albania
-
 Algeria
-
 Angola
-
 Argentina
-
 Armenia
-
 Australia
-
 Austria
-
 Azerbaijan
-
 Bahamas
-
 Bahrain
-
 Bangladesh
-
 Belarus
-
 Belgium
-
 Bolivia
-
 Botswana
-
 Brazil
-
 Brunei
-
 Bulgaria
-
 Cambodia
-
 Cameroon
-
 Canada
-
 Chile
Chile
-
 China
China
-
 Colombia
-
 Congo
Congo
-
 Costa Rica
-
 Cote d'Ivoire
-
 Croatia
-
 Cuba
Cuba
-
 Cyprus
-
 Czechia
-
 DR Congo
-
 Denmark
-
 Dominican Republic
-
 Ecuador
-
 Egypt
Egypt
-
 El Salvador
-
 Estonia
-
 Eswatini
-
 Ethiopia
-
 Finland
-
 France
-
 Georgia
-
 Germany
-
 Ghana
Ghana
-
 Greece
-
 Haiti
Haiti
-
 Hong Kong
-
 Hungary
-
 India
India
-
 Indonesia
-
 Iran, Islamic republic
-
 Iraq
Iraq
-
 Ireland
-
 Israel
-
 Italy
Italy
-
 Jamaica
-
 Japan
Japan
-
 Jordan
-
 Kazakhstan
-
 Kenya
Kenya
-
 Korea
Korea
-
 Kuwait
-
 Kyrgyzstan
-
 Laos
Laos
-
 Latvia
-
 Lebanon
-
 Lesotho
-
 Libya
Libya
-
 Lithuania
-
 Luxembourg
-
 Madagascar
-
 Malaysia
-
 Malta
Malta
-
 Mauritius
-
 Mexico
-
 Moldova
-
 Mongolia
-
 Montenegro
-
 Morocco
-
 Mozambique
-
 Myanmar
-
 Namibia
-
 Nepal
Nepal
-
 Netherlands
-
 New Zealand
-
 Nigeria
-
 North Macedonia
-
 Norway
-
 Oman
Oman
-
 Pakistan
-
 Palestine
-
 Panama
-
 Papua New Guinea
-
 Paraguay
-
 Peru
Peru
-
 Philippines
-
 Poland
-
 Portugal
-
 Puerto Rico
-
 Qatar
Qatar
-
 Reunion
-
 Romania
-
 Rwanda
-
 Saudi Arabia
-
 Serbia
-
 Singapore
-
 Slovakia
-
 Slovenia
-
 Somalia
-
 South Africa
-
 Spain
Spain
-
 Sri Lanka
-
 Sweden
-
 Switzerland
-
 Syria
Syria
-
 Taiwan
-
 Tajikistan
-
 Tanzania
-
 Thailand
-
 Trinidad and Tobago
-
 Tunisia
-
 Turkey
-
 UAE
UAE
-
 Uganda
-
 Ukraine
-
 United Kingdom
-
United States
-
 Uruguay
-
 Uzbekistan
-
 Venezuela
-
 Vietnam
-
 Yemen
Yemen
-
 Zambia
-
 Zimbabwe
- Forex
- Crypto












