

Why is Dutch Bros stock down today? Key support levels to watch

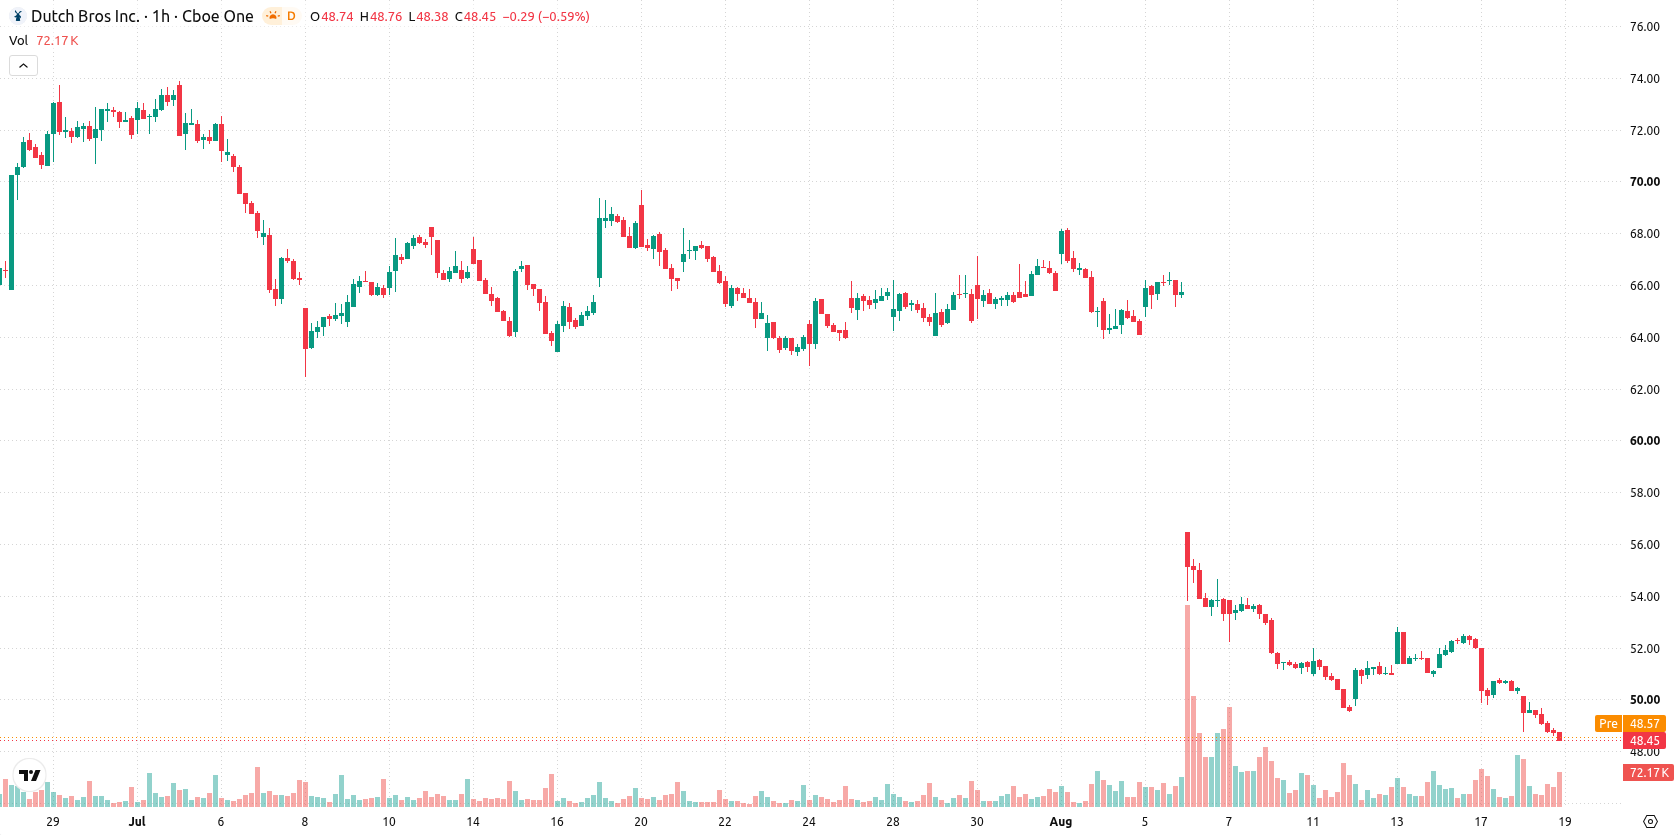
Dutch Bros (BROS) stock is trading at $48.44, marking a daily decline of 3.93%. The price is currently positioned below its key moving averages, reflecting persistent downward momentum in the short and long term.
 35.69
37.45
Highlights
- BROS/USD trades below all key moving averages, indicating persistent selling pressure across short and long timeframes.
- Technical indicators confirm strong seller control intraday, with negative momentum and several oscillators in an oversold condition.
- Expected range for the next few days is $46.46 to $50.42, with a high probability of further downside and limited rebound potential.
Strong sell signals as BROS sustains oversold technicals
BROS/USD is trading below the MA-20 at $50.54, MA-50 at $50.97, and remains well beneath the MA-200 at $57.56. The Ichimoku Kijun sits at $50.48, serving as immediate resistance. Momentum remains decisively negative, as both MACD and ADX point to a strong sell bias. RSI is very low at 26.74, with Stoch RSI, CCI, and Bull/Bear Power all confirming an oversold condition and seller dominance intraday. The Awesome Oscillator aligns with the overall downside, as the price is near the session low with heightened volatility.
Range-bound outlook as breakout risk defines next move
Over the next few trading days, BROS is expected to consolidate within the $46.46–$50.42 range, reflecting typical volatility relative to current levels. A bullish reversal remains unlikely unless there is a break above the $50.48 resistance, which could trigger a technical retracement higher. If renewed selling pushes the price below the key $46.46 support, the downtrend is likely to extend further.
Earlier, analysts noted that Dutch Bros was facing ongoing technical weakness, with downside momentum dominating the price action. The current setup reinforces this bearish scenario, with traders advised to closely monitor the $46.46 support area as any breach could accelerate further declines.






Latest Dutch Bros News




-
 Afghanistan
-
 Albania
-
 Algeria
-
 Angola
-
 Argentina
-
 Armenia
-
 Australia
-
 Austria
-
 Azerbaijan
-
 Bahamas
-
 Bahrain
-
 Bangladesh
-
 Belarus
-
 Belgium
-
 Bolivia
-
 Botswana
-
 Brazil
-
 Brunei
-
 Bulgaria
-
 Cambodia
-
 Cameroon
-
 Canada
-
 Chile
-
 China
-
 Colombia
-
 Congo
-
 Costa Rica
-
 Cote d'Ivoire
-
 Croatia
-
 Cuba
-
 Cyprus
-
 Czechia
-
 DR Congo
-
 Denmark
-
 Dominican Republic
-
 Ecuador
-
 Egypt
-
 El Salvador
-
 Estonia
-
 Eswatini
-
 Ethiopia
-
 Finland
-
 France
-
 Georgia
-
 Germany
-
 Ghana
-
 Greece
-
 Haiti
-
 Hong Kong
-
 Hungary
-
 India
-
 Indonesia
-
 Iran, Islamic republic
-
 Iraq
-
 Ireland
-
 Israel
-
 Italy
-
 Jamaica
-
 Japan
-
 Jordan
-
 Kazakhstan
-
 Kenya
-
 Korea
-
 Kuwait
-
 Kyrgyzstan
-
 Laos
-
 Latvia
-
 Lebanon
-
 Lesotho
-
 Libya
-
 Lithuania
-
 Luxembourg
-
 Madagascar
-
 Malaysia
-
 Malta
-
 Mauritius
-
 Mexico
-
 Moldova
-
 Mongolia
-
 Montenegro
-
 Morocco
-
 Mozambique
-
 Myanmar
-
 Namibia
-
 Nepal
-
 Netherlands
-
 New Zealand
-
 Nigeria
-
 North Macedonia
-
 Norway
-
 Oman
-
 Pakistan
-
 Palestine
-
 Panama
-
 Papua New Guinea
-
 Paraguay
-
 Peru
-
 Philippines
-
 Poland
-
 Portugal
-
 Puerto Rico
-
 Qatar
-
 Reunion
-
 Romania
-
 Rwanda
-
 Saudi Arabia
-
 Serbia
-
 Singapore
-
 Slovakia
-
 Slovenia
-
 Somalia
-
 South Africa
-
 Spain
-
 Sri Lanka
-
 Sweden
-
 Switzerland
-
 Syria
-
 Taiwan
-
 Tajikistan
-
 Tanzania
-
 Thailand
-
 Trinidad and Tobago
-
 Tunisia
-
 Turkey
-
 UAE
-
 Uganda
-
 Ukraine
-
 United Kingdom
-
United States
-
 Uruguay
-
 Uzbekistan
-
 Venezuela
-
 Vietnam
-
 Yemen
-
 Zambia
-
 Zimbabwe
- Forex
- Crypto












