


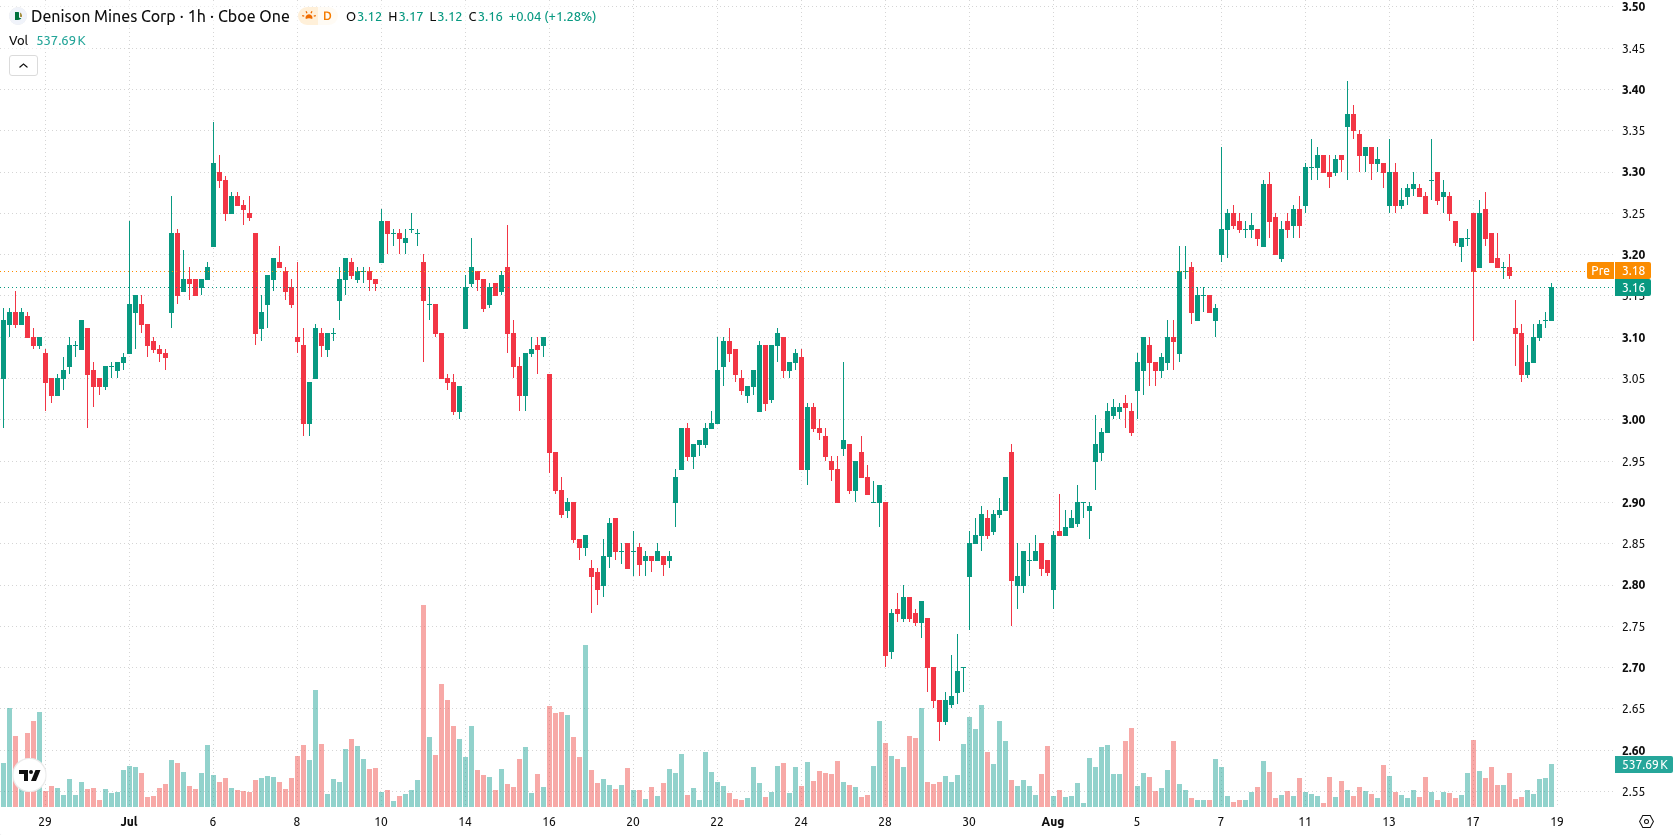
Denison Mines (DNN) stock is trading at $3.15, marking a daily decline of 1.25%. The price remains below its key moving averages, reflecting continued downside momentum in the current session.
 2.43
2.82
2.43
2.82
Highlights
- DNN/USD trades below key short, medium, and long-term moving averages, indicating a sustained bearish setup.
- Technical indicators including MACD and ADX show ongoing sell signals, though some intraday buyer strength is present.
- The price is forecasted to fluctuate between $2.98 and $3.32 over the next sessions, with resistance at $3.20 and 58% probability of an upward move.
Mixed momentum signals as intraday buyers emerge at resistance
DNN trades below the MA-20 at $3.18, MA-50 at $3.24, and MA-200 at $3.31, with the Ichimoku Kijun at $3.20 forming immediate resistance on the daily chart. Momentum remains negative, as both MACD and ADX signal a Sell stance. RSI posts 44.57 (Sell) but is not in oversold territory, while Stochastic RSI and CCI turn Neutral, suggesting a brief pause in downward acceleration. Notably, Bull/Bear Power indicates a Strong Buy, highlighting pronounced intraday buyer activity even as broader momentum signals diverge.
Sideways bias dominates as breakout probabilities remain split
Over the next several sessions, DNN is projected to move within a volatility band of $2.98 to $3.32. The upward breakout probability is assessed at 58%, with a 42% chance of further decline. The baseline scenario envisions prolonged sideways price action, with a close above the $3.20 resistance needed to open the way toward the upper end of the range, while a break below $2.98 increases downside risk.
Earlier, analysts noted that Denison Mines was displaying short- and medium-term resilience despite a prevailing bearish structure. The current analysis signals a shift toward continued downside momentum, with traders advised to monitor the $3.20 resistance and $2.98 support as pivotal levels for potential breakout or further decline.





Latest Denison Mines News





-
 Afghanistan
-
 Albania
-
 Algeria
-
 Angola
-
 Argentina
-
 Armenia
-
 Australia
-
 Austria
-
 Azerbaijan
-
 Bahamas
-
 Bahrain
-
 Bangladesh
-
 Belarus
-
 Belgium
-
 Bolivia
-
 Botswana
-
 Brazil
-
 Brunei
-
 Bulgaria
-
 Cambodia
-
 Cameroon
-
 Canada
-
 Chile
Chile
-
 China
China
-
 Colombia
-
 Congo
Congo
-
 Costa Rica
-
 Cote d'Ivoire
-
 Croatia
-
 Cuba
Cuba
-
 Cyprus
-
 Czechia
-
 DR Congo
-
 Denmark
-
 Dominican Republic
-
 Ecuador
-
 Egypt
Egypt
-
 El Salvador
-
 Estonia
-
 Eswatini
-
 Ethiopia
-
 Finland
-
 France
-
 Georgia
-
 Germany
-
 Ghana
Ghana
-
 Greece
-
 Haiti
Haiti
-
 Hong Kong
-
 Hungary
-
 India
India
-
 Indonesia
-
 Iran, Islamic republic
-
 Iraq
Iraq
-
 Ireland
-
 Israel
-
 Italy
Italy
-
 Jamaica
-
 Japan
Japan
-
 Jordan
-
 Kazakhstan
-
 Kenya
Kenya
-
 Korea
Korea
-
 Kuwait
-
 Kyrgyzstan
-
 Laos
Laos
-
 Latvia
-
 Lebanon
-
 Lesotho
-
 Libya
Libya
-
 Lithuania
-
 Luxembourg
-
 Madagascar
-
 Malaysia
-
 Malta
Malta
-
 Mauritius
-
 Mexico
-
 Moldova
-
 Mongolia
-
 Montenegro
-
 Morocco
-
 Mozambique
-
 Myanmar
-
 Namibia
-
 Nepal
Nepal
-
 Netherlands
-
 New Zealand
-
 Nigeria
-
 North Macedonia
-
 Norway
-
 Oman
Oman
-
 Pakistan
-
 Palestine
-
 Panama
-
 Papua New Guinea
-
 Paraguay
-
 Peru
Peru
-
 Philippines
-
 Poland
-
 Portugal
-
 Puerto Rico
-
 Qatar
Qatar
-
 Reunion
-
 Romania
-
 Rwanda
-
 Saudi Arabia
-
 Serbia
-
 Singapore
-
 Slovakia
-
 Slovenia
-
 Somalia
-
 South Africa
-
 Spain
Spain
-
 Sri Lanka
-
 Sweden
-
 Switzerland
-
 Syria
Syria
-
 Taiwan
-
 Tajikistan
-
 Tanzania
-
 Thailand
-
 Trinidad and Tobago
-
 Tunisia
-
 Turkey
-
 UAE
UAE
-
 Uganda
-
 Ukraine
-
 United Kingdom
-
United States
-
 Uruguay
-
 Uzbekistan
-
 Venezuela
-
 Vietnam
-
 Yemen
Yemen
-
 Zambia
-
 Zimbabwe
- Forex
- Crypto












