

Quantum Computing stock falls over 3% as technical selling accelerates downtrend

Quantum Computing Inc. (QUBT) fell 3.35% as renewed technical selling drove the stock further below its short-, medium-, and long-term moving averages. The downtrend is reinforced by the price trading beneath the 20-day, 50-day, and 200-day marks, with momentum and oscillators pointing to continued near-term pressure.
 6.63
6.93
Highlights
- Shares of Quantum Computing trade below key short-, medium-, and long-term moving averages, confirming downward pressure across timeframes.
- Since the open, a downside gap of 1.76% and a 3.35% decline position the price near session lows with intraday volatility at 3.16%.
- Technical signals are mixed, with oscillators showing oversold and weak trend strength; the 5-day forecast range is $7.86 to $8.63, with a 79% likelihood of a downward move.
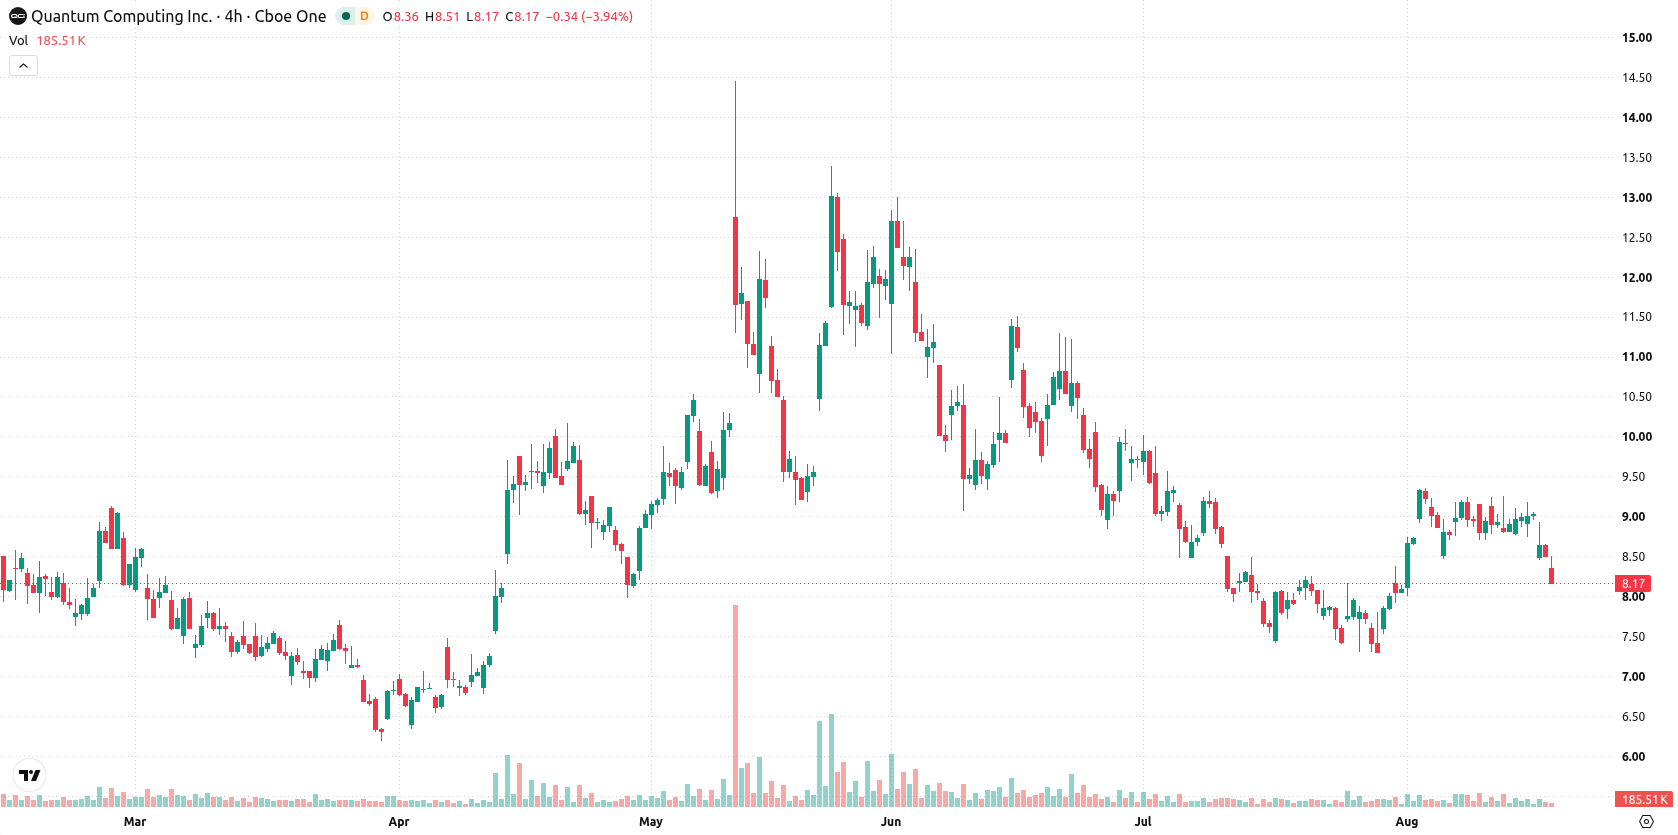
Mixed momentum and weak trend as price tests support beneath moving averages
Quantum Computing remains under pressure, with the stock trading below the 20-day, 50-day, and 200-day moving averages at $8.47, $8.96, and $9.82, respectively. This setup indicates short-, medium-, and long-term bias to the downside, with the Ichimoku Kijun at $8.32 acting as immediate resistance and support marked at $8.22. Momentum is mixed: the Moving Average Convergence Divergence (MACD) points to a possible buy, but the Average Directional Index (ADX) signals weak trend strength and Stochastic RSI shows the stock as oversold. The Relative Strength Index (RSI) at 47.22 also hints at a soft "sell," and the Commodity Channel Index (CCI) remains neutral. Bull/Bear Power (BBP) above zero signals subtle buyer dominance intraday, yet today's downside gap of about 1.76% and a drop to $8.24, down 3.35%, places the price near session lows with intraday volatility at 3.16%. The stock is under pressure after the open, and momentum signals are divergent.
Earlier, analysts noted that Quantum Computing Inc. continued to face significant downside risk due to persistent technical and macroeconomic pressures. The current analysis reinforces this bearish outlook, highlighting $8.22 as a critical support; failure to hold could accelerate losses toward $7.86 in the coming sessions.






Latest Quantum Computing News




-
 Afghanistan
-
 Albania
-
 Algeria
-
 Angola
-
 Argentina
-
 Armenia
-
 Australia
-
 Austria
-
 Azerbaijan
-
 Bahamas
-
 Bahrain
-
 Bangladesh
-
 Belarus
-
 Belgium
-
 Bolivia
-
 Botswana
-
 Brazil
-
 Brunei
-
 Bulgaria
-
 Cambodia
-
 Cameroon
-
 Canada
-
 Chile
-
 China
-
 Colombia
-
 Congo
-
 Costa Rica
-
 Cote d'Ivoire
-
 Croatia
-
 Cuba
-
 Cyprus
-
 Czechia
-
 DR Congo
-
 Denmark
-
 Dominican Republic
-
 Ecuador
-
 Egypt
-
 El Salvador
-
 Estonia
-
 Eswatini
-
 Ethiopia
-
 Finland
-
 France
-
 Georgia
-
 Germany
-
 Ghana
-
 Greece
-
 Haiti
-
 Hong Kong
-
 Hungary
-
 India
-
 Indonesia
-
 Iran, Islamic republic
-
 Iraq
-
 Ireland
-
 Israel
-
 Italy
-
 Jamaica
-
 Japan
-
 Jordan
-
 Kazakhstan
-
 Kenya
-
 Korea
-
 Kuwait
-
 Kyrgyzstan
-
 Laos
-
 Latvia
-
 Lebanon
-
 Lesotho
-
 Libya
-
 Lithuania
-
 Luxembourg
-
 Madagascar
-
 Malaysia
-
 Malta
-
 Mauritius
-
 Mexico
-
 Moldova
-
 Mongolia
-
 Montenegro
-
 Morocco
-
 Mozambique
-
 Myanmar
-
 Namibia
-
 Nepal
-
 Netherlands
-
 New Zealand
-
 Nigeria
-
 North Macedonia
-
 Norway
-
 Oman
-
 Pakistan
-
 Palestine
-
 Panama
-
 Papua New Guinea
-
 Paraguay
-
 Peru
-
 Philippines
-
 Poland
-
 Portugal
-
 Puerto Rico
-
 Qatar
-
 Reunion
-
 Romania
-
 Rwanda
-
 Saudi Arabia
-
 Serbia
-
 Singapore
-
 Slovakia
-
 Slovenia
-
 Somalia
-
 South Africa
-
 Spain
-
 Sri Lanka
-
 Sweden
-
 Switzerland
-
 Syria
-
 Taiwan
-
 Tajikistan
-
 Tanzania
-
 Thailand
-
 Trinidad and Tobago
-
 Tunisia
-
 Turkey
-
 UAE
-
 Uganda
-
 Ukraine
-
 United Kingdom
-
United States
-
 Uruguay
-
 Uzbekistan
-
 Venezuela
-
 Vietnam
-
 Yemen
-
 Zambia
-
 Zimbabwe
- Forex
- Crypto












