

Why is SoFi stock falling today? Key support levels to watch

SoFi Technologies, Inc. (SOFI) stock is trading at $17.73 after falling 3.8% today. The shares are positioned below their key moving averages, indicating that they remain under broad technical pressure.
 15.75
17.04
Highlights
- SoFi Technologies reported record adjusted net revenue of $1.2 billion in the second quarter, rising 40% year over year and surpassing earnings expectations.
- Strong customer growth and record loan originations led to adjusted net income of $160 million with a 13% net profit margin.
- Shares of SoFi currently trade under selling pressure below key moving averages, with the expected trading range set at $17.14 to $18.32 and a high probability of further downside in the immediate term.
Record revenue growth strengthens SoFi’s base despite market weakness
SoFi Technologies reported record adjusted net revenue of $1.2 billion in the second quarter, representing a 40% year-over-year increase and beating adjusted EPS expectations by $0.01, according to Tipranks. Alongside this, the company posted record loan originations and strong customer growth, contributing to adjusted net income of $160 million and a 13% net profit margin in the quarter, as reported by Finance Yahoo. These results highlight a significant acceleration in SoFi's core performance and strengthen its financial position, though price action has remained under broader selling pressure.
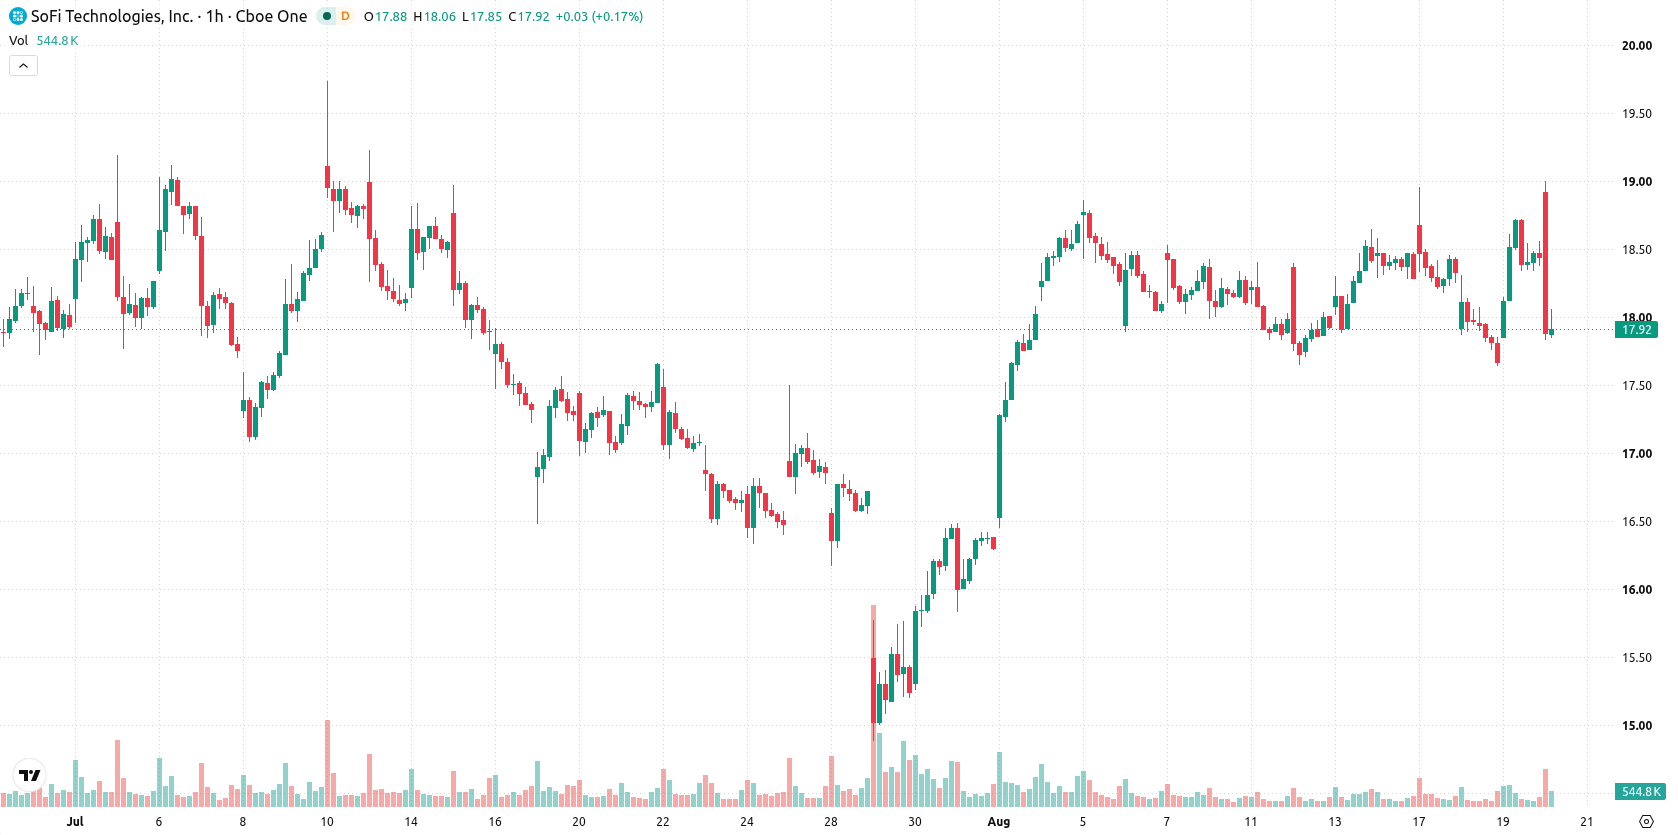
Momentum divided as support tests intraday lows amid resistance
On the technical front, SOFI trades below its MA-20 ($18.18) and MA-50 ($18.16) levels on the hourly chart, and it remains well beneath the MA-200 ($20.63) in the daily timeframe. Immediate resistance is marked by the Ichimoku Kijun at $18.3. RSI is at 44.79, while CCI gives a Sell signal, both suggesting mild downside but no oversold extremes. ADX and Bull/Bear Power also favor sellers intraday, whereas MACD and Stochastic RSI are Neutral; the Awesome Oscillator does not provide directional support, indicating divergence among momentum indicators. The price currently sits near the day’s low, with intraday action described as volatile.
Downside risk elevated as range-bound action limits bullish cases
Looking ahead, the expected trading range over the next several days is $17.14 to $18.32, reflecting the typical volatility band relative to current levels. The probability of an upward move in the immediate term is considered very low, while the likelihood of continued downside remains high. The baseline scenario points to consolidation within this corridor, with a bullish scenario requiring a decisive breakout above $18.3. Conversely, increased bearish momentum would materialize if SOFI drops below the $17.14 support.
Earlier, analysts noted that SoFi's breakout above key moving averages signaled a shift toward buyer dominance and the potential for a sustained uptrend. However, with current technicals now showing persistent pressure and an immediate resistance at $18.3, traders should closely monitor whether the stock can reclaim this threshold to signal any reversal of the prevailing bearish trend.











-
 Afghanistan
-
 Albania
-
 Algeria
-
 Angola
-
 Argentina
-
 Armenia
-
 Australia
-
 Austria
-
 Azerbaijan
-
 Bahamas
-
 Bahrain
-
 Bangladesh
-
 Belarus
-
 Belgium
-
 Bolivia
-
 Botswana
-
 Brazil
-
 Brunei
-
 Bulgaria
-
 Cambodia
-
 Cameroon
-
 Canada
-
 Chile
-
 China
-
 Colombia
-
 Congo
-
 Costa Rica
-
 Cote d'Ivoire
-
 Croatia
-
 Cuba
-
 Cyprus
-
 Czechia
-
 DR Congo
-
 Denmark
-
 Dominican Republic
-
 Ecuador
-
 Egypt
-
 El Salvador
-
 Estonia
-
 Eswatini
-
 Ethiopia
-
 Finland
-
 France
-
 Georgia
-
 Germany
-
 Ghana
-
 Greece
-
 Haiti
-
 Hong Kong
-
 Hungary
-
 India
-
 Indonesia
-
 Iran, Islamic republic
-
 Iraq
-
 Ireland
-
 Israel
-
 Italy
-
 Jamaica
-
 Japan
-
 Jordan
-
 Kazakhstan
-
 Kenya
-
 Korea
-
 Kuwait
-
 Kyrgyzstan
-
 Laos
-
 Latvia
-
 Lebanon
-
 Lesotho
-
 Libya
-
 Lithuania
-
 Luxembourg
-
 Madagascar
-
 Malaysia
-
 Malta
-
 Mauritius
-
 Mexico
-
 Moldova
-
 Mongolia
-
 Montenegro
-
 Morocco
-
 Mozambique
-
 Myanmar
-
 Namibia
-
 Nepal
-
 Netherlands
-
 New Zealand
-
 Nigeria
-
 North Macedonia
-
 Norway
-
 Oman
-
 Pakistan
-
 Palestine
-
 Panama
-
 Papua New Guinea
-
 Paraguay
-
 Peru
-
 Philippines
-
 Poland
-
 Portugal
-
 Puerto Rico
-
 Qatar
-
 Reunion
-
 Romania
-
 Rwanda
-
 Saudi Arabia
-
 Serbia
-
 Singapore
-
 Slovakia
-
 Slovenia
-
 Somalia
-
 South Africa
-
 Spain
-
 Sri Lanka
-
 Sweden
-
 Switzerland
-
 Syria
-
 Taiwan
-
 Tajikistan
-
 Tanzania
-
 Thailand
-
 Trinidad and Tobago
-
 Tunisia
-
 Turkey
-
 UAE
-
 Uganda
-
 Ukraine
-
 United Kingdom
-
United States
-
 Uruguay
-
 Uzbekistan
-
 Venezuela
-
 Vietnam
-
 Yemen
-
 Zambia
-
 Zimbabwe
- Forex
- Crypto












