

SOFI rallies as Q2 2026 debit and transaction volume growth supports sentiment

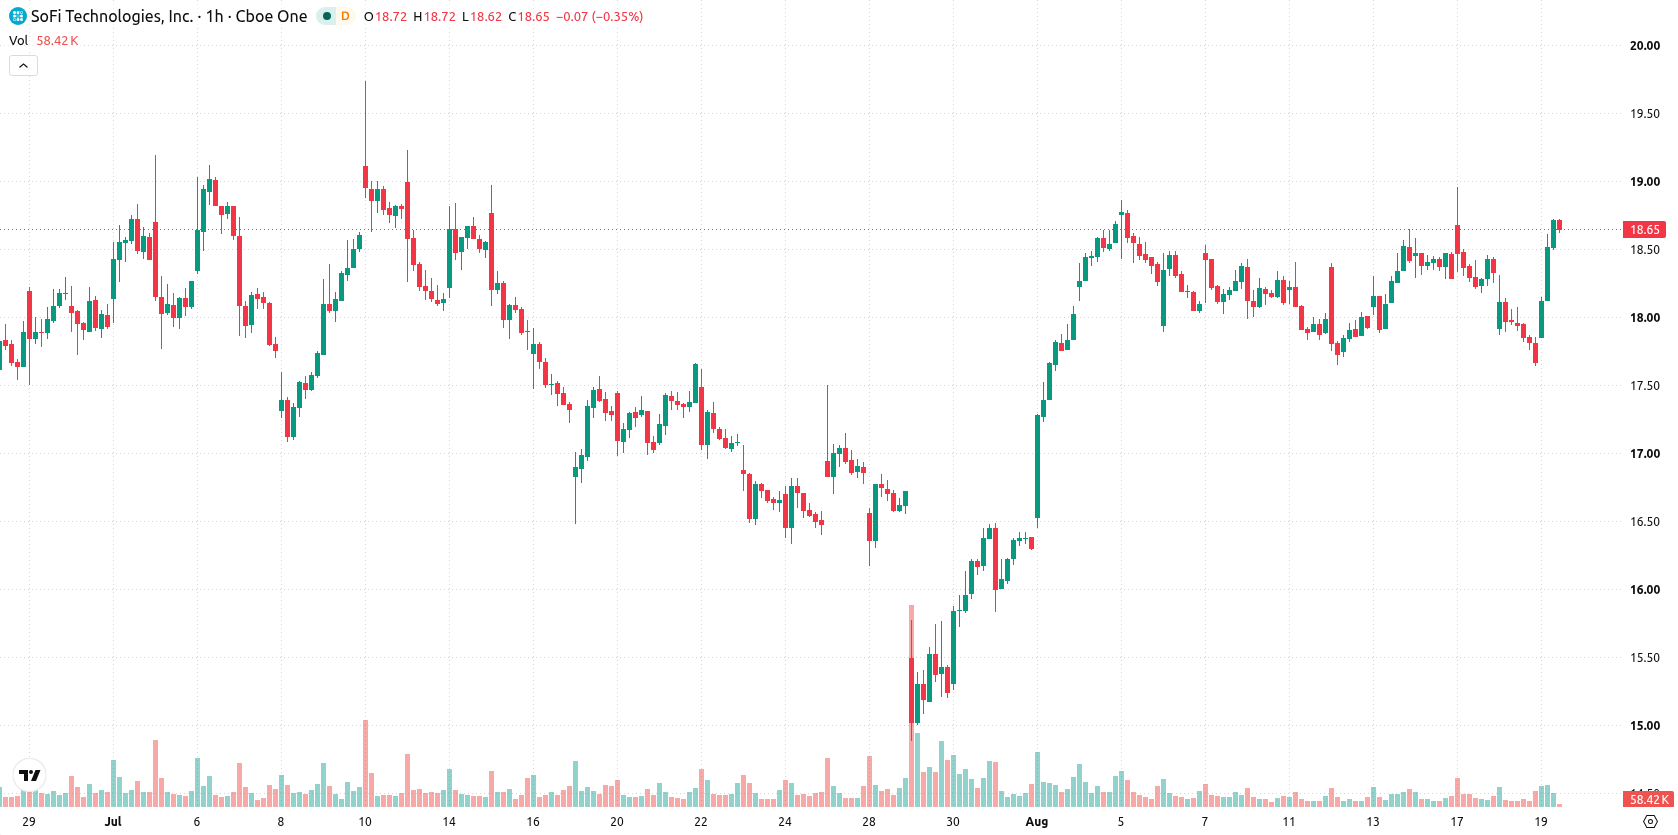
SoFi (SOFI) stock is trading at $18.62, up 5.41% on the day. The price sits above its key short- and medium-term moving averages, while remaining beneath long-term averages.
 17.60
17.63
Highlights
- SoFi reported increased debit spending and transaction volumes across all categories in the second quarter of 2026.
- Saved cards became the leading payment method and contactless tap-to-pay usage increased in SoFi's ecosystem.
- Shares of SoFi rose 5.41% to $18.62, with technical indicators mixed and the forecasted price range for the coming days at $18.03 to $19.21.
Rising transactions and tap-to-pay growth fuel positive sentiment
SoFi has reported notable growth in debit spending and transaction volumes across all tracked categories in the second quarter of 2026, with saved cards emerging as the leading payment method and contactless tap-to-pay adoption on the rise, according to Investing.com. This expansion in consumer payment activity reflects deepening engagement with SoFi's platform and an increased flow of transactions through its ecosystem. The surge in operational metrics reinforces confidence in SoFi's product strategy, supporting heightened market participation and positive sentiment.
Overbought indicators and support levels raise reversal risk
On the hourly chart, SOFI is trading above the MA-20 at $18.21 and MA-50 at $18.15, while remaining below the long-term MA-200 at $20.68. The Ichimoku Kijun level at $18.3 serves as immediate support. Among momentum indicators, RSI stands at 62.68 and signals a buy, with ADX confirming buyer strength; both MACD and Awesome Oscillator are neutral, while Stoch RSI and CCI highlight overbought conditions. Bull/Bear Power continues to show buyer dominance intraday. Notably, price action is exhibiting a divergence from overbought oscillator readings, suggesting a risk of short-term reversal or consolidation.
Consolidation expected as volatility heightens breakout potential
In the short term, SOFI is expected to trade within a range of $18.03 to $19.21, with volatility elevated relative to recent sessions. The probability of an upward continuation is assessed above 80%, while the likelihood of a downward move is below 20%. The baseline scenario calls for consolidation between these support and resistance levels; a breakout above $19.21 could trigger accelerated gains, while a drop beneath $18.03 would raise the risk of a deeper correction toward lower support.
Earlier, analysts noted that SoFi was exhibiting persistent downside momentum despite improving fundamentals. The current breakout above key moving averages signals a notable shift toward buyer dominance, with the focus now on whether the stock can sustain gains above $19.21 to confirm a sustained uptrend.










-
 Afghanistan
-
 Albania
-
 Algeria
-
 Angola
-
 Argentina
-
 Armenia
-
 Australia
-
 Austria
-
 Azerbaijan
-
 Bahamas
-
 Bahrain
-
 Bangladesh
-
 Belarus
-
 Belgium
-
 Bolivia
-
 Botswana
-
 Brazil
-
 Brunei
-
 Bulgaria
-
 Cambodia
-
 Cameroon
-
 Canada
-
 Chile
-
 China
-
 Colombia
-
 Congo
-
 Costa Rica
-
 Cote d'Ivoire
-
 Croatia
-
 Cuba
-
 Cyprus
-
 Czechia
-
 DR Congo
-
 Denmark
-
 Dominican Republic
-
 Ecuador
-
 Egypt
-
 El Salvador
-
 Estonia
-
 Eswatini
-
 Ethiopia
-
 Finland
-
 France
-
 Georgia
-
 Germany
-
 Ghana
-
 Greece
-
 Haiti
-
 Hong Kong
-
 Hungary
-
 India
-
 Indonesia
-
 Iran, Islamic republic
-
 Iraq
-
 Ireland
-
 Israel
-
 Italy
-
 Jamaica
-
 Japan
-
 Jordan
-
 Kazakhstan
-
 Kenya
-
 Korea
-
 Kuwait
-
 Kyrgyzstan
-
 Laos
-
 Latvia
-
 Lebanon
-
 Lesotho
-
 Libya
-
 Lithuania
-
 Luxembourg
-
 Madagascar
-
 Malaysia
-
 Malta
-
 Mauritius
-
 Mexico
-
 Moldova
-
 Mongolia
-
 Montenegro
-
 Morocco
-
 Mozambique
-
 Myanmar
-
 Namibia
-
 Nepal
-
 Netherlands
-
 New Zealand
-
 Nigeria
-
 North Macedonia
-
 Norway
-
 Oman
-
 Pakistan
-
 Palestine
-
 Panama
-
 Papua New Guinea
-
 Paraguay
-
 Peru
-
 Philippines
-
 Poland
-
 Portugal
-
 Puerto Rico
-
 Qatar
-
 Reunion
-
 Romania
-
 Rwanda
-
 Saudi Arabia
-
 Serbia
-
 Singapore
-
 Slovakia
-
 Slovenia
-
 Somalia
-
 South Africa
-
 Spain
-
 Sri Lanka
-
 Sweden
-
 Switzerland
-
 Syria
-
 Taiwan
-
 Tajikistan
-
 Tanzania
-
 Thailand
-
 Trinidad and Tobago
-
 Tunisia
-
 Turkey
-
 UAE
-
 Uganda
-
 Ukraine
-
 United Kingdom
-
United States
-
 Uruguay
-
 Uzbekistan
-
 Venezuela
-
 Vietnam
-
 Yemen
-
 Zambia
-
 Zimbabwe
- Forex
- Crypto












