

Will SoFi stock avoid deeper losses amid seller pressure and oversold conditions?

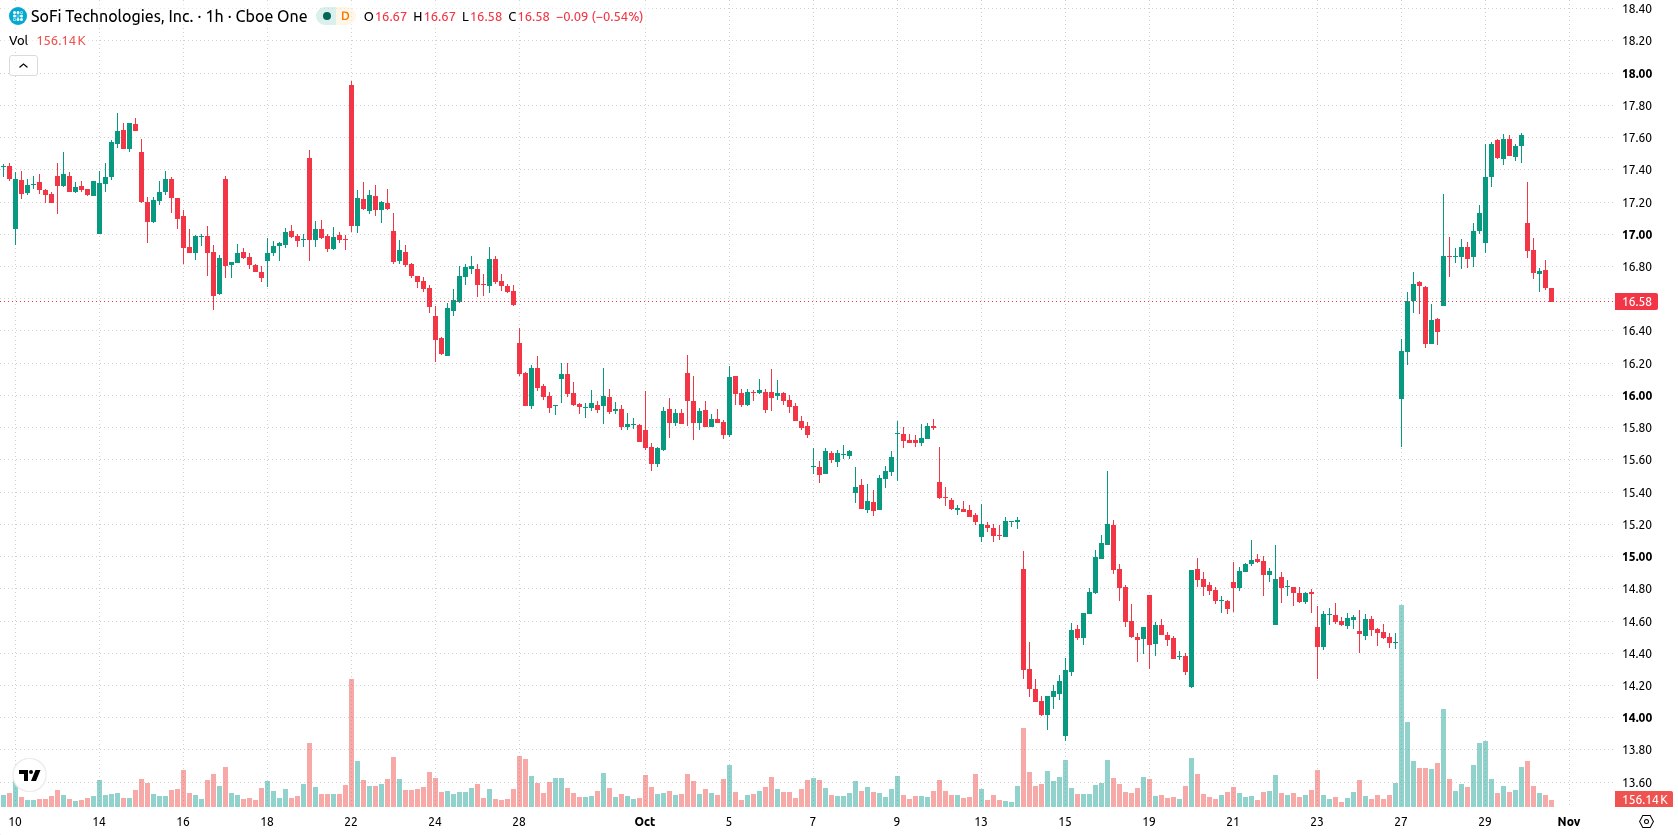
SoFi (SOFI) stock is trading at $16.54, down 6.1% on the day and closing near its daily low in a session of low volatility. The price currently sits below its key moving averages, indicating near-term weakness.
 16.97
17.63
Highlights
- SoFi Technologies delivered record third quarter 2026 results with $1.34 billion in revenue and $241 million net income, beating consensus estimates.
- Total deposits grew by $5.8 billion to $51.3 billion, with net interest margin advancing to 6.14% as Convergence Financial LLC raised its stake.
- Shares closed down 6.1% to $16.54, trading in a sideways range with key support at $16.03 and a forecasted $15.11 to $17.97 range.
Institutional buying and strong earnings outpaced by selling pressure
SoFi Technologies reported record third quarter 2026 results, with revenue reaching $1.34 billion and net income of $241 million, both surpassing consensus expectations, according to Simplywall. The company also saw total deposits rise by $5.8 billion to $51.3 billion and net interest margin improve to 6.14% over the same period, based on data from Thestreet. Additionally, Marketbeat reported that Convergence Financial LLC increased its stake in SoFi by 11.6% in the third quarter through an SEC Form 13F disclosure, reflecting sustained institutional participation. These positive corporate actions have not prevented shares from closing lower, as broader selling pressure remains evident.
Upside momentum persists as price tests technical boundaries
SOFI trades below the MA-20 at $17.02 and MA-200 at $17.83, but remains above the MA-50 at $15.77. The Ichimoku Kijun line at $16.03 marks immediate support. Intraday technicals show MACD and ADX suggest continuing upside momentum, though Bull/Bear Power highlights seller dominance within the session. The RSI stands at 53, indicating a neutral to slightly bullish setup, while the Stochastic RSI signals oversold conditions. CCI and the Awesome Oscillator both remain neutral.
Range-bound price action anticipated amid support-resistance tests
Over the next two to three trading days, SOFI is expected to consolidate within the $15.11 to $17.97 price band, reflecting typical volatility near current levels. The baseline scenario favors range-bound movement. A bullish scenario would see a breakout above resistance, with upside targets toward $17.97, while a bearish case could result in a test of key support at $15.11.
Earlier, analysts noted that strong business performance and record loan originations provided a fundamental basis for continued market demand in SoFi shares. The current setup introduces a more cautious outlook, with technical and price action signals now highlighting $15.11 as a key support level for traders to monitor in the near term.






Latest SoFi News





-
 Afghanistan
-
 Albania
-
 Algeria
-
 Angola
-
 Argentina
-
 Armenia
-
 Australia
-
 Austria
-
 Azerbaijan
-
 Bahamas
-
 Bahrain
-
 Bangladesh
-
 Belarus
-
 Belgium
-
 Bolivia
-
 Botswana
-
 Brazil
-
 Brunei
-
 Bulgaria
-
 Cambodia
-
 Cameroon
-
 Canada
-
 Chile
-
 China
-
 Colombia
-
 Congo
-
 Costa Rica
-
 Cote d'Ivoire
-
 Croatia
-
 Cuba
-
 Cyprus
-
 Czechia
-
 DR Congo
-
 Denmark
-
 Dominican Republic
-
 Ecuador
-
 Egypt
-
 El Salvador
-
 Estonia
-
 Eswatini
-
 Ethiopia
-
 Finland
-
 France
-
 Georgia
-
 Germany
-
 Ghana
-
 Greece
-
 Haiti
-
 Hong Kong
-
 Hungary
-
 India
-
 Indonesia
-
 Iran, Islamic republic
-
 Iraq
-
 Ireland
-
 Israel
-
 Italy
-
 Jamaica
-
 Japan
-
 Jordan
-
 Kazakhstan
-
 Kenya
-
 Korea
-
 Kuwait
-
 Kyrgyzstan
-
 Laos
-
 Latvia
-
 Lebanon
-
 Lesotho
-
 Libya
-
 Lithuania
-
 Luxembourg
-
 Madagascar
-
 Malaysia
-
 Malta
-
 Mauritius
-
 Mexico
-
 Moldova
-
 Mongolia
-
 Montenegro
-
 Morocco
-
 Mozambique
-
 Myanmar
-
 Namibia
-
 Nepal
-
 Netherlands
-
 New Zealand
-
 Nigeria
-
 North Macedonia
-
 Norway
-
 Oman
-
 Pakistan
-
 Palestine
-
 Panama
-
 Papua New Guinea
-
 Paraguay
-
 Peru
-
 Philippines
-
 Poland
-
 Portugal
-
 Puerto Rico
-
 Qatar
-
 Reunion
-
 Romania
-
 Rwanda
-
 Saudi Arabia
-
 Serbia
-
 Singapore
-
 Slovakia
-
 Slovenia
-
 Somalia
-
 South Africa
-
 Spain
-
 Sri Lanka
-
 Sweden
-
 Switzerland
-
 Syria
-
 Taiwan
-
 Tajikistan
-
 Tanzania
-
 Thailand
-
 Trinidad and Tobago
-
 Tunisia
-
 Turkey
-
 UAE
-
 Uganda
-
 Ukraine
-
 United Kingdom
-
United States
-
 Uruguay
-
 Uzbekistan
-
 Venezuela
-
 Vietnam
-
 Yemen
-
 Zambia
-
 Zimbabwe
- Forex
- Crypto












