

Why is Nvidia stock down today? AI server price hike drives pullback, key support to watch

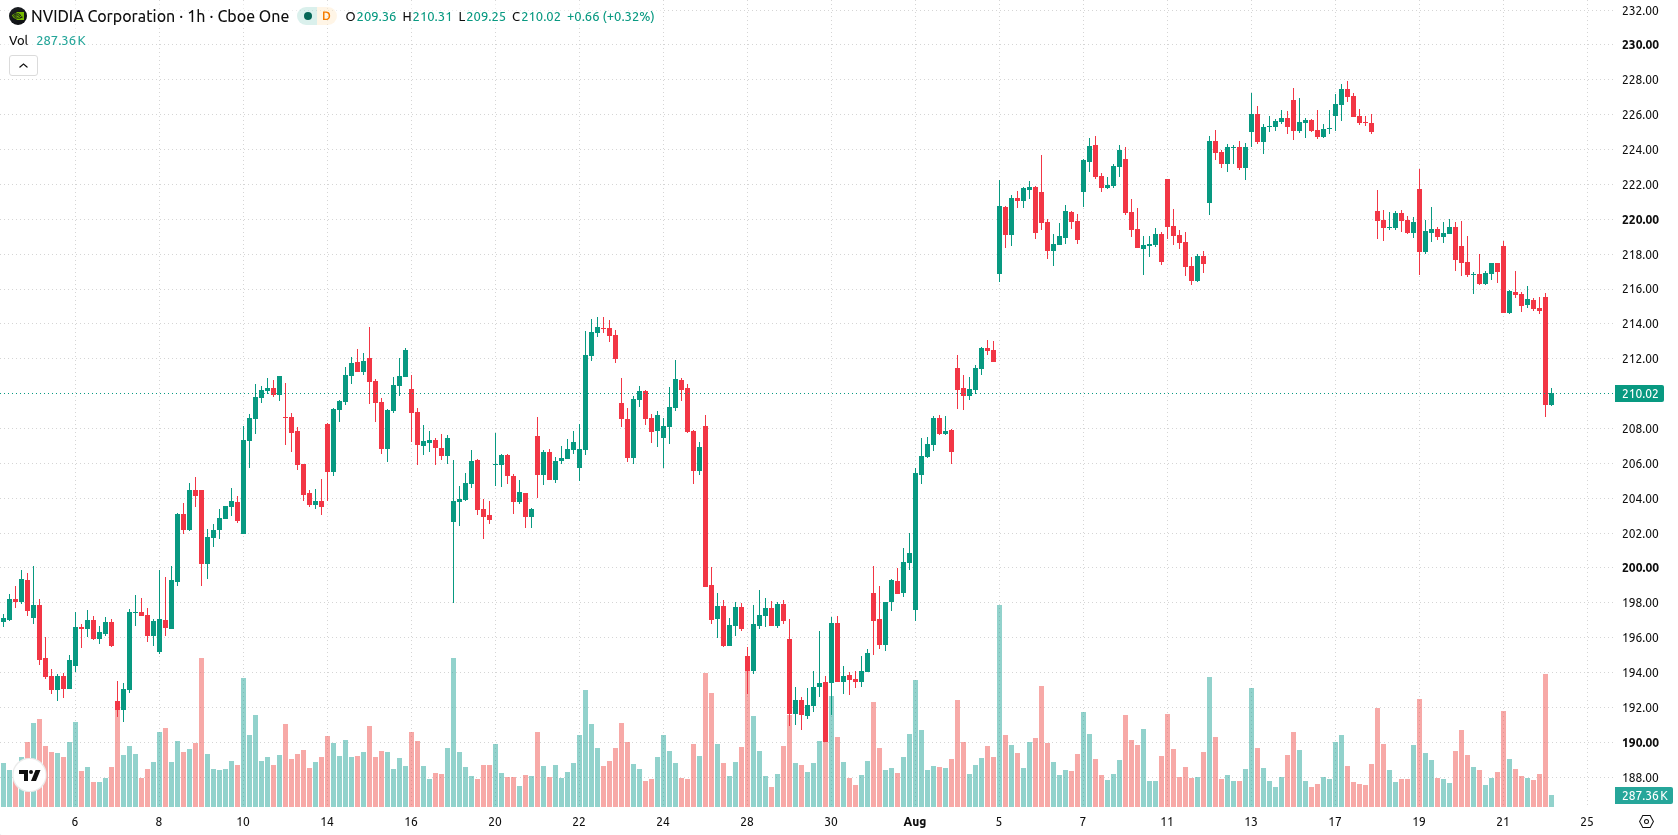
Nvidia (NVDA) stock is trading at $209.2, posting a daily decline of 2.73%. The price stands below its key moving averages but holds above important long-term levels.
 207.56
219.18
Highlights
- Nvidia will raise AI server system prices by over 15% for shipments beginning in early 2027 due to increased memory costs.
- Nvidia is in talks to invest in AI startup Perplexity at a potential valuation above $30 billion, expanding its presence in artificial intelligence.
- Shares of Nvidia closed at $209.2, falling 2.73%, with technical signals showing short-term bearish pressure and an expected range of $205.5 to $214.58 in the coming days.
Margin risk grows as AI hardware prices rise and demand uncertain
Nvidia has informed its largest customers of more than a 15% price hike for AI server systems, including Vera Rubin and Grace Blackwell chips, on shipments starting in early 2027 in response to higher memory costs, as reported by Tomshardware. This advance notice may dampen forward hardware demand amid increased procurement expenses and raises questions about long-term margin sustainability. Nvidia is also reportedly in talks to invest in the AI startup Perplexity, potentially valued at over $30 billion according to Investing.com, which could open additional growth channels within the artificial intelligence sector.
Mixed technical signals as long-term support clashes with selling pressure
Technically, NVDA closed below the MA-20 at $216.63 and the MA-50 at $220.78 on the H1 timeframe. Price remained above the MA-200 on the daily chart ($195.28), signaling that longer-term technical support still persists. The Ichimoku Kijun level at $218.69 represents the nearest resistance. Among oscillators, MACD indicated firm selling, the ADX was neutral, and the RSI at 35.26 together with CCI both reflected oversold conditions. Stoch RSI produced a buy signal, but Bull/Bear Power continued to show intraday control by sellers. The Awesome Oscillator was neutral, leaving a non-confirmation of the current move. Price activity ended near the daily low, and indicator divergence suggests weak conviction with conflicting momentum signals.
Downside risk prevails as volatility bands tighten outlook
Over the next two to three sessions, NVDA is likely to fluctuate in a range of $205.5 to $214.58, a volatility band relative to current levels. The probability of a downward move is higher, estimated at 64%, while the chance of a rebound stands at 36%. The baseline scenario anticipates price consolidation within this corridor. However, a breakout above $218.69 could support further upside momentum, while a loss of support near $205.5 would open scope for extended losses in the short term.
Earlier, analysts noted that Nvidia's growing costs and risks of higher AI server prices could constrain the broader AI infrastructure outlook. The latest confirmation of price hikes for AI server systems through 2027 adds to those concerns and places heightened importance on the $205.5 support zone as a key level to watch for signs of further downside risk.






Latest NVIDIA News



-
 Afghanistan
-
 Albania
-
 Algeria
-
 Angola
-
 Argentina
-
 Armenia
-
 Australia
-
 Austria
-
 Azerbaijan
-
 Bahamas
-
 Bahrain
-
 Bangladesh
-
 Belarus
-
 Belgium
-
 Bolivia
-
 Botswana
-
 Brazil
-
 Brunei
-
 Bulgaria
-
 Cambodia
-
 Cameroon
-
 Canada
-
 Chile
-
 China
-
 Colombia
-
 Congo
-
 Costa Rica
-
 Cote d'Ivoire
-
 Croatia
-
 Cuba
-
 Cyprus
-
 Czechia
-
 DR Congo
-
 Denmark
-
 Dominican Republic
-
 Ecuador
-
 Egypt
-
 El Salvador
-
 Estonia
-
 Eswatini
-
 Ethiopia
-
 Finland
-
 France
-
 Georgia
-
 Germany
-
 Ghana
-
 Greece
-
 Haiti
-
 Hong Kong
-
 Hungary
-
 India
-
 Indonesia
-
 Iran, Islamic republic
-
 Iraq
-
 Ireland
-
 Israel
-
 Italy
-
 Jamaica
-
 Japan
-
 Jordan
-
 Kazakhstan
-
 Kenya
-
 Korea
-
 Kuwait
-
 Kyrgyzstan
-
 Laos
-
 Latvia
-
 Lebanon
-
 Lesotho
-
 Libya
-
 Lithuania
-
 Luxembourg
-
 Madagascar
-
 Malaysia
-
 Malta
-
 Mauritius
-
 Mexico
-
 Moldova
-
 Mongolia
-
 Montenegro
-
 Morocco
-
 Mozambique
-
 Myanmar
-
 Namibia
-
 Nepal
-
 Netherlands
-
 New Zealand
-
 Nigeria
-
 North Macedonia
-
 Norway
-
 Oman
-
 Pakistan
-
 Palestine
-
 Panama
-
 Papua New Guinea
-
 Paraguay
-
 Peru
-
 Philippines
-
 Poland
-
 Portugal
-
 Puerto Rico
-
 Qatar
-
 Reunion
-
 Romania
-
 Rwanda
-
 Saudi Arabia
-
 Serbia
-
 Singapore
-
 Slovakia
-
 Slovenia
-
 Somalia
-
 South Africa
-
 Spain
-
 Sri Lanka
-
 Sweden
-
 Switzerland
-
 Syria
-
 Taiwan
-
 Tajikistan
-
 Tanzania
-
 Thailand
-
 Trinidad and Tobago
-
 Tunisia
-
 Turkey
-
 UAE
-
 Uganda
-
 Ukraine
-
 United Kingdom
-
United States
-
 Uruguay
-
 Uzbekistan
-
 Venezuela
-
 Vietnam
-
 Yemen
-
 Zambia
-
 Zimbabwe
- Forex
- Crypto












