


Zoom (ZM) stock is trading at $103.49, marking a daily decline of 3.76%. The price currently sits below its key short- and medium-term moving averages, with some underlying longer-term support still in place.
 99.25
99.98
99.25
99.98
Highlights
- Zoom Video Communications will report second quarter fiscal 2027 earnings after the close on August 25, 2026.
- The upcoming earnings event can drive volatility and repositioning as investors adjust to potential company performance changes.
- Shares of Zoom are trading below short- and medium-term moving averages with momentum and oscillators signaling oversold conditions; the expected range is $100.08 to $105.42 with a 68% probability of further downside.
Investor positioning shifts ahead of looming earnings release
Zoom Video Communications is set to release its second quarter fiscal 2027 earnings after the market closes on August 25, 2026. The approach of this earnings date often prompts repositioning among investors, as market participants assess potential changes in company performance once results are disclosed. This upcoming event can heighten volatility or lead to profit-taking as market expectations adjust ahead of reported financials.
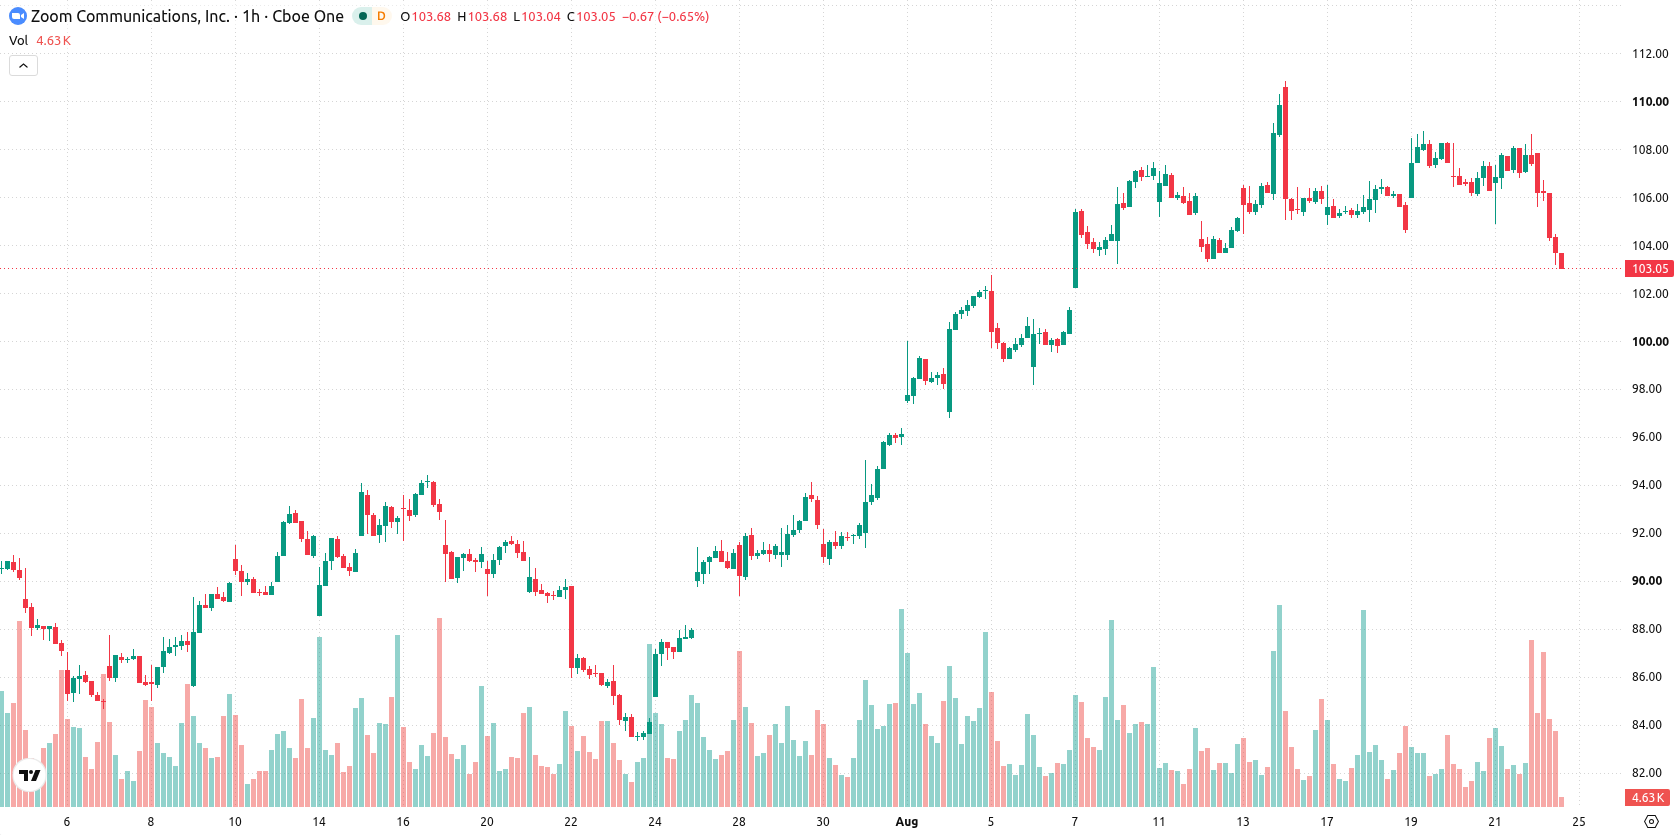
Sustained bearish momentum as price breaches multiple indicators
Technical action on ZM is defined by the price trading below the MA-20 at $106.7 and the MA-50 at $106.47 on the hourly chart, while maintaining a position above the MA-200 at $89.68. The immediate resistance is marked by the Ichimoku Kijun at $105.99. On the indicator side, MACD shows a sell signal and ADX is neutral. RSI is at 34.01, indicating a sell, with both Stochastic RSI and CCI in oversold territory. Bull/Bear Power is also oversold, confirming the dominance of sellers in the short term. The Awesome Oscillator remains neutral and does not provide further directional confirmation.
Downside favored as volatility bands define consolidation risks
In the near term, the expected trading range for ZM is $100.08 to $105.42, representing the typical volatility band relative to current levels. There is a 68% chance of further downside continuation, while the probability of an upward move is less. The baseline scenario foresees ZM consolidating within this corridor. If price breaks above the $105.99 resistance, a short-term recovery may occur via short covering; if $100.08 fails as support, further declines toward lower levels are likely.
Earlier, analysts noted that Zoom shares were facing near-term pressure but maintained longer-term support, highlighting a balance of mixed technical signals. The current analysis signals a shift toward downside risk ahead of earnings, with $100.08 now emerging as a key short-term support level for traders to monitor.










-
 Afghanistan
-
 Albania
-
 Algeria
-
 Angola
-
 Argentina
-
 Armenia
-
 Australia
-
 Austria
-
 Azerbaijan
-
 Bahamas
-
 Bahrain
-
 Bangladesh
-
 Belarus
-
 Belgium
-
 Bolivia
-
 Botswana
-
 Brazil
-
 Brunei
-
 Bulgaria
-
 Cambodia
-
 Cameroon
-
 Canada
-
 Chile
Chile
-
 China
China
-
 Colombia
-
 Congo
Congo
-
 Costa Rica
-
 Cote d'Ivoire
-
 Croatia
-
 Cuba
Cuba
-
 Cyprus
-
 Czechia
-
 DR Congo
-
 Denmark
-
 Dominican Republic
-
 Ecuador
-
 Egypt
Egypt
-
 El Salvador
-
 Estonia
-
 Eswatini
-
 Ethiopia
-
 Finland
-
 France
-
 Georgia
-
 Germany
-
 Ghana
Ghana
-
 Greece
-
 Haiti
Haiti
-
 Hong Kong
-
 Hungary
-
 India
India
-
 Indonesia
-
 Iran, Islamic republic
-
 Iraq
Iraq
-
 Ireland
-
 Israel
-
 Italy
Italy
-
 Jamaica
-
 Japan
Japan
-
 Jordan
-
 Kazakhstan
-
 Kenya
Kenya
-
 Korea
Korea
-
 Kuwait
-
 Kyrgyzstan
-
 Laos
Laos
-
 Latvia
-
 Lebanon
-
 Lesotho
-
 Libya
Libya
-
 Lithuania
-
 Luxembourg
-
 Madagascar
-
 Malaysia
-
 Malta
Malta
-
 Mauritius
-
 Mexico
-
 Moldova
-
 Mongolia
-
 Montenegro
-
 Morocco
-
 Mozambique
-
 Myanmar
-
 Namibia
-
 Nepal
Nepal
-
 Netherlands
-
 New Zealand
-
 Nigeria
-
 North Macedonia
-
 Norway
-
 Oman
Oman
-
 Pakistan
-
 Palestine
-
 Panama
-
 Papua New Guinea
-
 Paraguay
-
 Peru
Peru
-
 Philippines
-
 Poland
-
 Portugal
-
 Puerto Rico
-
 Qatar
Qatar
-
 Reunion
-
 Romania
-
 Rwanda
-
 Saudi Arabia
-
 Serbia
-
 Singapore
-
 Slovakia
-
 Slovenia
-
 Somalia
-
 South Africa
-
 Spain
Spain
-
 Sri Lanka
-
 Sweden
-
 Switzerland
-
 Syria
Syria
-
 Taiwan
-
 Tajikistan
-
 Tanzania
-
 Thailand
-
 Trinidad and Tobago
-
 Tunisia
-
 Turkey
-
 UAE
UAE
-
 Uganda
-
 Ukraine
-
 United Kingdom
-
United States
-
 Uruguay
-
 Uzbekistan
-
 Venezuela
-
 Vietnam
-
 Yemen
Yemen
-
 Zambia
-
 Zimbabwe
- Forex
- Crypto












