

Costco shares weekly forecast: Overbought short-term signals hint at possible pause

Shares of Costco Wholesale Corporation (COST) are trading near $964 as a steady 1.8% weekly gain keeps the recovery setup in place, though the stretch is starting to draw notice. Strong buying momentum persists but short-term technicals signal possible exhaustion, leaving traders watching for a potential pause or pullback as the week begins.
 1021.31
Highlights
- Shares of Costco gained 1.77% over the past week, maintaining price above all key moving averages.
- Indicators show the stock in overbought territory with strong recent buyer activity but signs of short-term exhaustion.
- Expected five-day trading range is $940.51 to $1,012, with 75% probability for an increase and key support at $959.42.
Multi-billion revenue and Medicare push drive active flows this week
Costco stock was active following a series of recent corporate developments, led by a robust quarterly performance and a quarterly dividend payout of $1.47 per share for shareholders of record as of July 24, 2026, according to Ad-Hoc News. The company is also entering the Medicare insurance market through a partnership with SCAN Health Plan, planning to offer Costco-branded Medicare Advantage and supplemental plans in select states pending regulatory approval, as reported by Yahoo Finance, Newsweek, and Investopedia. Costco continues to report strong membership fee revenue and high renewal rates above 92% in the U.S. and Canada, helping to support its strong cash position and regular dividend increases. Fiscal Q3 results confirmed multi-billion dollar revenues and $18.9 billion in cash, reinforcing support for the current trend.
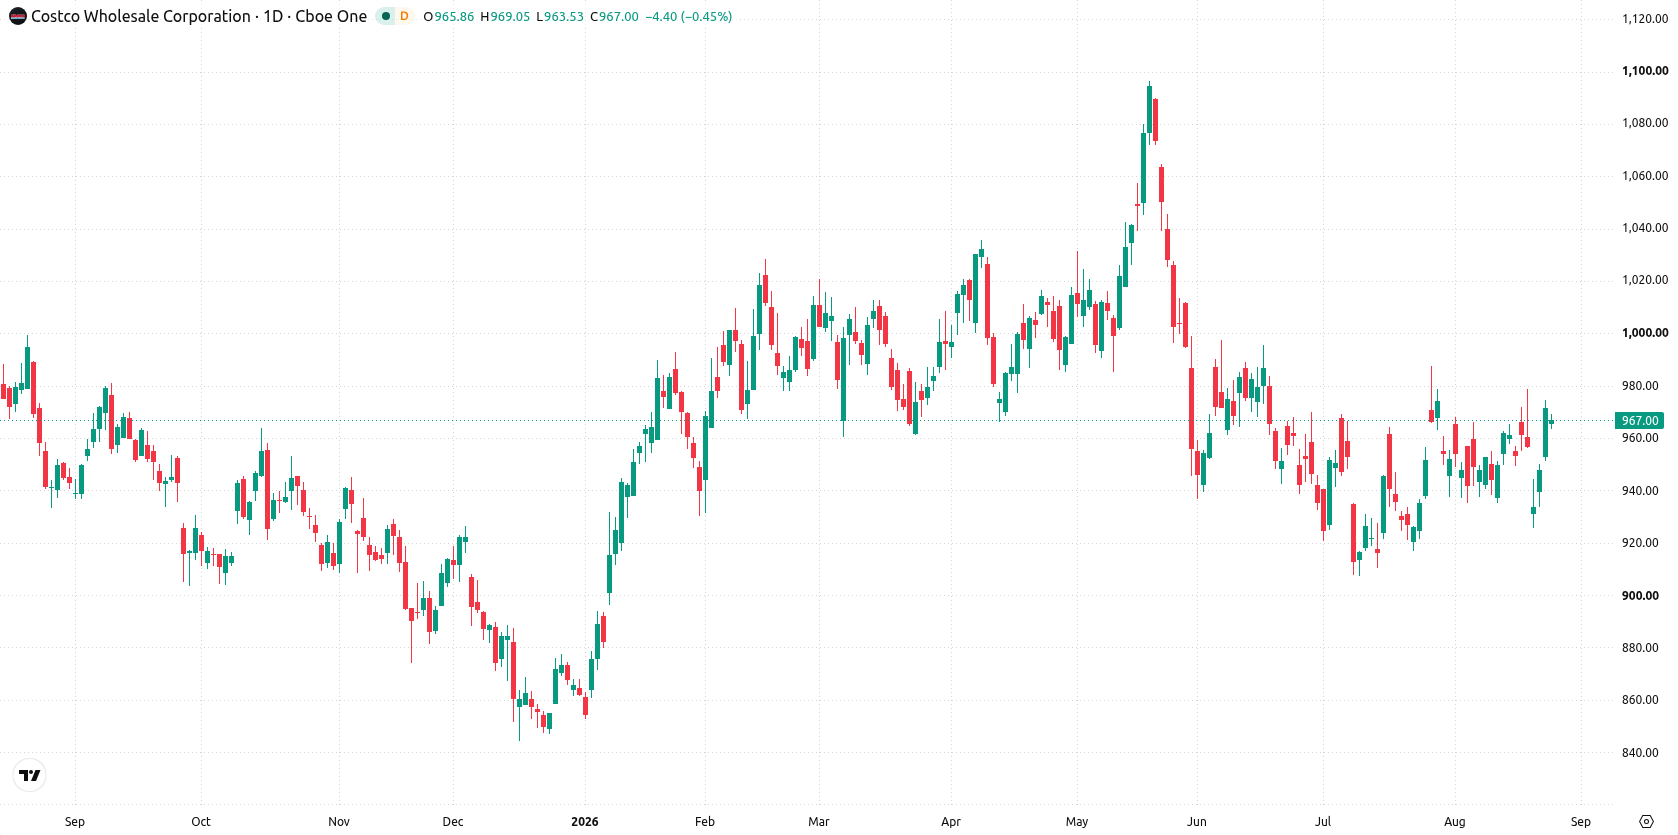
Overbought signals emerge as weekly volatility and buyer strength dominate
On the daily chart, Costco’s structure is marked by a flat trend within a contained move and 5.72% volatility across the week. RSI sits in neutral territory at 57.76, but both CCI and Stochastic RSI register as overbought, pointing to short-term exhaustion. Bull/Bear Power is also in the overbought state, highlighting strong recent buyer dominance but suggesting a pause is possible. Support lines up at $959.42—right at the 200-day—alongside the $952.16 Ichimoku Kijun, while resistance stands at $978.7.
Rangebound outlook for the week with breakout risks from key levels
For the next five trading days, the expected range is $940.51 to $1,012, with probabilities set at 75% for an increase and 25% for a decrease. Base case is for more contained trading, with the stock consolidating between $959.42 and $978.7. A sustained push above $978.7 would clear room toward the upper end of the forecast range, while any slip below $959.42 brings $952.16 and possibly $940.51 into focus.
Earlier, analysts noted that sector trends and company-specific execution were key considerations shaping outlooks for major stocks as they responded to evolving market and investment dynamics. The current analysis reinforces this approach, highlighting Costco’s mix of robust corporate developments and technical signals pointing to a potential consolidation phase, with $978.7 as the key level to monitor for any breakout or retracement.











-
 Afghanistan
-
 Albania
-
 Algeria
-
 Angola
-
 Argentina
-
 Armenia
-
 Australia
-
 Austria
-
 Azerbaijan
-
 Bahamas
-
 Bahrain
-
 Bangladesh
-
 Belarus
-
 Belgium
-
 Bolivia
-
 Botswana
-
 Brazil
-
 Brunei
-
 Bulgaria
-
 Cambodia
-
 Cameroon
-
 Canada
-
 Chile
-
 China
-
 Colombia
-
 Congo
-
 Costa Rica
-
 Cote d'Ivoire
-
 Croatia
-
 Cuba
-
 Cyprus
-
 Czechia
-
 DR Congo
-
 Denmark
-
 Dominican Republic
-
 Ecuador
-
 Egypt
-
 El Salvador
-
 Estonia
-
 Eswatini
-
 Ethiopia
-
 Finland
-
 France
-
 Georgia
-
 Germany
-
 Ghana
-
 Greece
-
 Haiti
-
 Hong Kong
-
 Hungary
-
 India
-
 Indonesia
-
 Iran, Islamic republic
-
 Iraq
-
 Ireland
-
 Israel
-
 Italy
-
 Jamaica
-
 Japan
-
 Jordan
-
 Kazakhstan
-
 Kenya
-
 Korea
-
 Kuwait
-
 Kyrgyzstan
-
 Laos
-
 Latvia
-
 Lebanon
-
 Lesotho
-
 Libya
-
 Lithuania
-
 Luxembourg
-
 Madagascar
-
 Malaysia
-
 Malta
-
 Mauritius
-
 Mexico
-
 Moldova
-
 Mongolia
-
 Montenegro
-
 Morocco
-
 Mozambique
-
 Myanmar
-
 Namibia
-
 Nepal
-
 Netherlands
-
 New Zealand
-
 Nigeria
-
 North Macedonia
-
 Norway
-
 Oman
-
 Pakistan
-
 Palestine
-
 Panama
-
 Papua New Guinea
-
 Paraguay
-
 Peru
-
 Philippines
-
 Poland
-
 Portugal
-
 Puerto Rico
-
 Qatar
-
 Reunion
-
 Romania
-
 Rwanda
-
 Saudi Arabia
-
 Serbia
-
 Singapore
-
 Slovakia
-
 Slovenia
-
 Somalia
-
 South Africa
-
 Spain
-
 Sri Lanka
-
 Sweden
-
 Switzerland
-
 Syria
-
 Taiwan
-
 Tajikistan
-
 Tanzania
-
 Thailand
-
 Trinidad and Tobago
-
 Tunisia
-
 Turkey
-
 UAE
-
 Uganda
-
 Ukraine
-
 United Kingdom
-
United States
-
 Uruguay
-
 Uzbekistan
-
 Venezuela
-
 Vietnam
-
 Yemen
-
 Zambia
-
 Zimbabwe
- Forex
- Crypto












