

Goldman Sachs shares gain almost 3% after strong Q2 earnings report and elevated dividend payout

The Goldman Sachs Group, Inc. (GS) surged 2.63% after reporting record second quarter 2026 earnings, fueled by a substantial revenue jump and a sharply higher dividend. The move is supported by GS trading above its major moving averages, confirming a bullish structure and upward momentum across all timeframes.
 920.47
932.40
Highlights
- Goldman Sachs reported record second quarter 2026 revenue of $20.34 billion and a 92% year-over-year surge in earnings per share.
- The company increased its quarterly dividend to $5.00 per share and continued repurchases under the $4 billion buyback program.
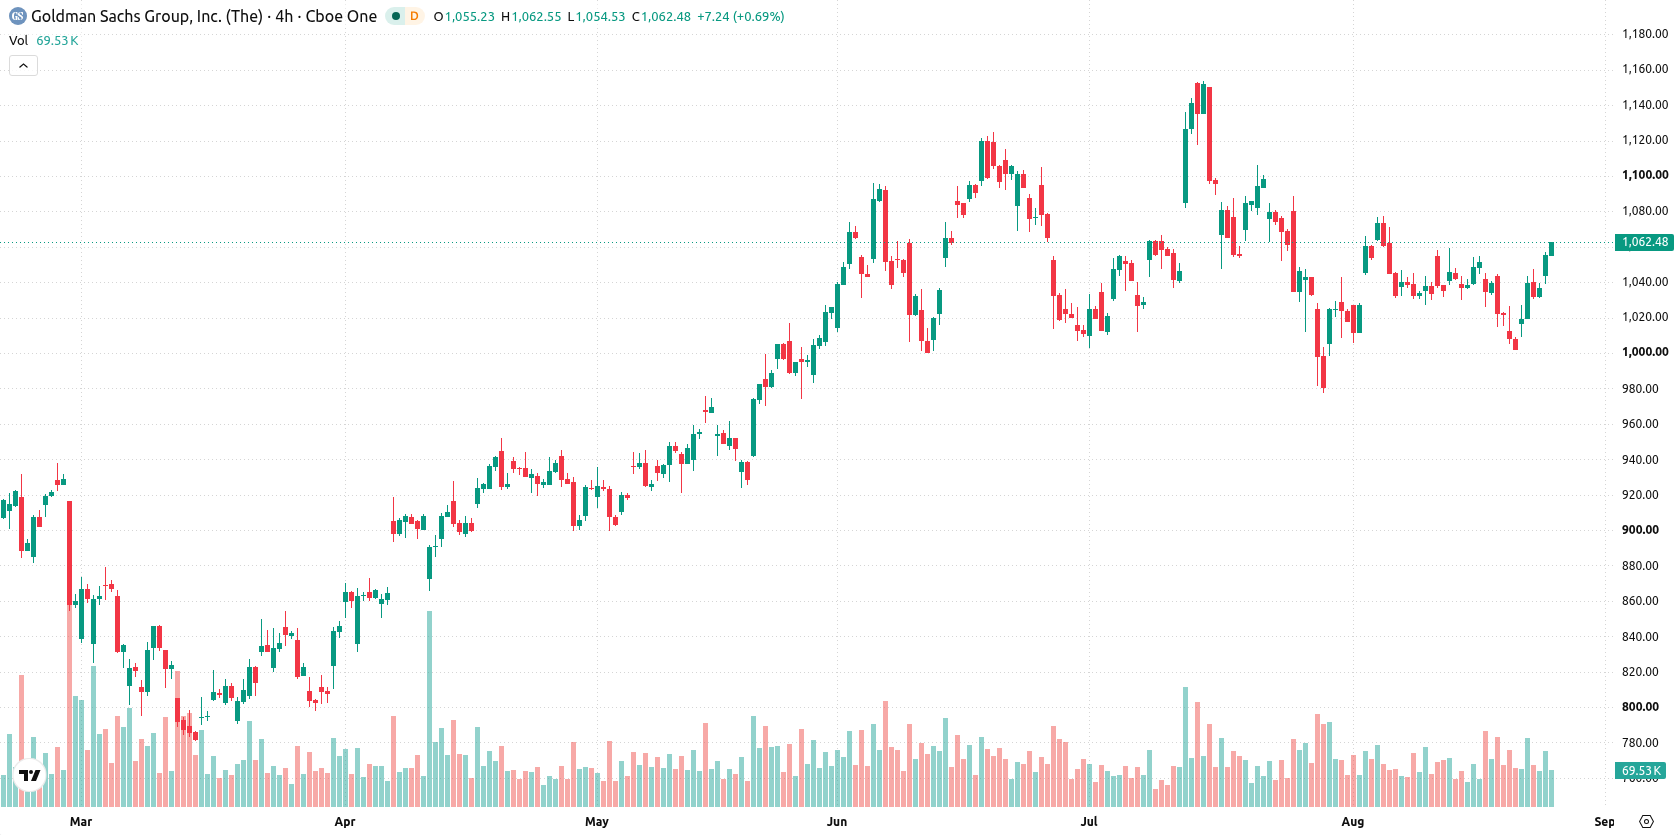
- Shares of Goldman Sachs trade with strong upward momentum near recent highs, with a five-day range expected between $1,036 and $1,086 as technical signals indicate a risk of near-term consolidation.
Shareholder returns prioritized as capital strategy bolsters sentiment
Goldman Sachs reported record second quarter 2026 earnings, with revenue of $20.34 billion and a 92% year-over-year increase in earnings per share. The company raised its quarterly dividend to $5.00 per share and continued share repurchases under its $4 billion buyback authorization. Capital management remains in focus as GS balances growth investments with shareholder returns through dividends and buybacks.
Mixed momentum limits confidence as bullish structure persists
Goldman Sachs is trading above its 20-day, 50-day, and 200-day moving averages ($1,032, $1,053, and $937.6, respectively), affirming bullish structure across all timeframes. This positioning confirms ongoing upward momentum, with a bullish long-term trend, and places near-term focus on the $1,053 floor and $1,086 ceiling. Momentum signals remain mixed: the MACD and RSI both indicate a weak or waning buying trend, with the RSI approaching neutral at 49.17 and MACD and Awesome Oscillator both flashing sell signals. Buyers currently dominate intraday momentum, as shown by Bull/Bear Power at 12.22, but the overbought forecast limits confidence in sustained advances. The stock opened with a small upside gap (about $2.72 or 0.26%), has gained $27.22 (2.63%) so far, is currently near the high of its $1,030 - $1,047 daily range, and intraday volatility stands at 1.66%. The intraday tone is strong toward the highs, although neutral readings from the ADX, CCI, and Stochastic RSI, combined with overbought BBP, point to the risk of consolidation or a pause after the recent climb.
Earlier, analysts noted that Goldman Sachs had established a position of technical strength supported by recent institutional accumulation and persistent buying momentum. The latest earnings-driven surge and dividend hike reinforce this view, with traders now advised to monitor the $1,036 to $1,086 range as a zone of potential consolidation or breakout over the coming sessions.






Latest Goldman Sachs News







-
 Afghanistan
-
 Albania
-
 Algeria
-
 Angola
-
 Argentina
-
 Armenia
-
 Australia
-
 Austria
-
 Azerbaijan
-
 Bahamas
-
 Bahrain
-
 Bangladesh
-
 Belarus
-
 Belgium
-
 Bolivia
-
 Botswana
-
 Brazil
-
 Brunei
-
 Bulgaria
-
 Cambodia
-
 Cameroon
-
 Canada
-
 Chile
-
 China
-
 Colombia
-
 Congo
-
 Costa Rica
-
 Cote d'Ivoire
-
 Croatia
-
 Cuba
-
 Cyprus
-
 Czechia
-
 DR Congo
-
 Denmark
-
 Dominican Republic
-
 Ecuador
-
 Egypt
-
 El Salvador
-
 Estonia
-
 Eswatini
-
 Ethiopia
-
 Finland
-
 France
-
 Georgia
-
 Germany
-
 Ghana
-
 Greece
-
 Haiti
-
 Hong Kong
-
 Hungary
-
 India
-
 Indonesia
-
 Iran, Islamic republic
-
 Iraq
-
 Ireland
-
 Israel
-
 Italy
-
 Jamaica
-
 Japan
-
 Jordan
-
 Kazakhstan
-
 Kenya
-
 Korea
-
 Kuwait
-
 Kyrgyzstan
-
 Laos
-
 Latvia
-
 Lebanon
-
 Lesotho
-
 Libya
-
 Lithuania
-
 Luxembourg
-
 Madagascar
-
 Malaysia
-
 Malta
-
 Mauritius
-
 Mexico
-
 Moldova
-
 Mongolia
-
 Montenegro
-
 Morocco
-
 Mozambique
-
 Myanmar
-
 Namibia
-
 Nepal
-
 Netherlands
-
 New Zealand
-
 Nigeria
-
 North Macedonia
-
 Norway
-
 Oman
-
 Pakistan
-
 Palestine
-
 Panama
-
 Papua New Guinea
-
 Paraguay
-
 Peru
-
 Philippines
-
 Poland
-
 Portugal
-
 Puerto Rico
-
 Qatar
-
 Reunion
-
 Romania
-
 Rwanda
-
 Saudi Arabia
-
 Serbia
-
 Singapore
-
 Slovakia
-
 Slovenia
-
 Somalia
-
 South Africa
-
 Spain
-
 Sri Lanka
-
 Sweden
-
 Switzerland
-
 Syria
-
 Taiwan
-
 Tajikistan
-
 Tanzania
-
 Thailand
-
 Trinidad and Tobago
-
 Tunisia
-
 Turkey
-
 UAE
-
 Uganda
-
 Ukraine
-
 United Kingdom
-
United States
-
 Uruguay
-
 Uzbekistan
-
 Venezuela
-
 Vietnam
-
 Yemen
-
 Zambia
-
 Zimbabwe
- Forex
- Crypto












