

Novo Nordisk shares technical analysis: Resistance test at $49.91 in focus

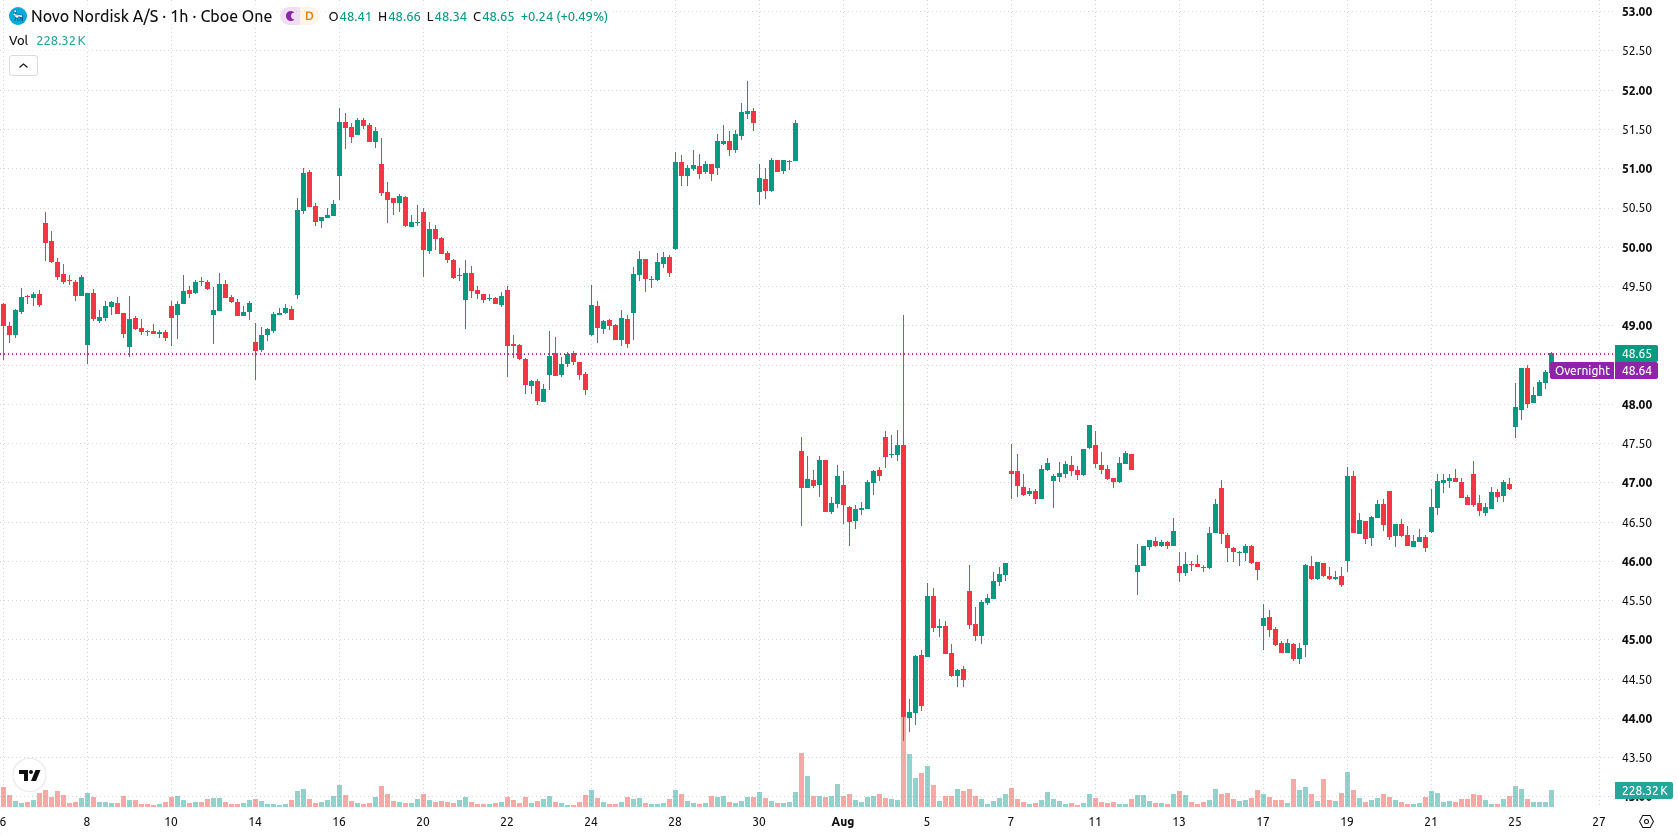
Novo Nordisk (NVO) stock is trading at $48.65 after climbing 3.68% on the day and remains positioned above its key moving averages. The price is holding near session highs, supported by positive intraday momentum and active trading interest.
 38.66
38.68
38.66
38.68
Highlights
- Novo Nordisk upgraded its full-year outlook after second-quarter 2026 profit and margin expansion exceeded expectations.
- Quarterly revenue reached $12 billion, with annual revenue at $46.70 billion and net profit at $15.48 billion, showing strong earnings power.
- Shares of Novo Nordisk gained 3.68% to $48.65, with technical signals showing continued bullish momentum and a projected range of $47.39 to $49.91.
Profit beat and outlook upgrade fuel investor demand
Novo Nordisk delivered a strong second-quarter 2026 profit beat, highlighting realized margin expansion and better-than-expected operating performance according to Gurufocus. The company upgraded its full-year outlook, which reflects confidence in ongoing business momentum and directly improves investor sentiment. Robust quarterly revenue of $12 billion, driven by strong uptake of oral Wegovy, confirms underlying top-line growth, while the latest annual figures of $46.70 billion in revenue and $15.48 billion in net profit further anchor the company's earnings power. Together, these developments have reinforced demand for NVO stock and explain the positive move on the day.
Strong momentum reinforces bullish structure above technical support
NVO remains above primary support levels, with the MA-20 at $47.36, MA-50 at $46.51 on the H1 chart, and the MA-200 at $46.41 on the daily chart. The Ichimoku Kijun at $47.39 is acting as immediate support. Momentum indicators reinforce the bullish structure: MACD and ADX both confirm sustained buying pressure, while RSI is elevated at 72.96, and Stochastic RSI, CCI, and Bull/Bear Power all show overbought conditions consistent with dominant buyer activity. The Awesome Oscillator supports the ongoing positive trend, and across all intraday technicals, there is no sign of negative divergence.
Upside bias dominates as tight price range contains risks
In the near term, NVO is expected to remain within a price range of $47.39 to $49.91, a volatility band relative to current levels. There is a 79% probability scenario targeting further upside within this corridor, while the risk of a downside move is limited to a 21% probability. A break above $49.91 would open the way for further gains, while a loss of support at $47.39 could drive a corrective move lower.
Earlier, analysts noted that Novo Nordisk's technical strength and expanding clinical pipeline were supporting a bullish outlook for the stock. The current market action and improving financial results reinforce this view, with the immediate range between $47.39 and $49.91 serving as the key zone for potential breakout or corrective movement ahead.





Latest Novo Nordisk News




-
 Afghanistan
-
 Albania
-
 Algeria
-
 Angola
-
 Argentina
-
 Armenia
-
 Australia
-
 Austria
-
 Azerbaijan
-
 Bahamas
-
 Bahrain
-
 Bangladesh
-
 Belarus
-
 Belgium
-
 Bolivia
-
 Botswana
-
 Brazil
-
 Brunei
-
 Bulgaria
-
 Cambodia
-
 Cameroon
-
 Canada
-
 Chile
Chile
-
 China
China
-
 Colombia
-
 Congo
Congo
-
 Costa Rica
-
 Cote d'Ivoire
-
 Croatia
-
 Cuba
Cuba
-
 Cyprus
-
 Czechia
-
 DR Congo
-
 Denmark
-
 Dominican Republic
-
 Ecuador
-
 Egypt
Egypt
-
 El Salvador
-
 Estonia
-
 Eswatini
-
 Ethiopia
-
 Finland
-
 France
-
 Georgia
-
 Germany
-
 Ghana
Ghana
-
 Greece
-
 Haiti
Haiti
-
 Hong Kong
-
 Hungary
-
 India
India
-
 Indonesia
-
 Iran, Islamic republic
-
 Iraq
Iraq
-
 Ireland
-
 Israel
-
 Italy
Italy
-
 Jamaica
-
 Japan
Japan
-
 Jordan
-
 Kazakhstan
-
 Kenya
Kenya
-
 Korea
Korea
-
 Kuwait
-
 Kyrgyzstan
-
 Laos
Laos
-
 Latvia
-
 Lebanon
-
 Lesotho
-
 Libya
Libya
-
 Lithuania
-
 Luxembourg
-
 Madagascar
-
 Malaysia
-
 Malta
Malta
-
 Mauritius
-
 Mexico
-
 Moldova
-
 Mongolia
-
 Montenegro
-
 Morocco
-
 Mozambique
-
 Myanmar
-
 Namibia
-
 Nepal
Nepal
-
 Netherlands
-
 New Zealand
-
 Nigeria
-
 North Macedonia
-
 Norway
-
 Oman
Oman
-
 Pakistan
-
 Palestine
-
 Panama
-
 Papua New Guinea
-
 Paraguay
-
 Peru
Peru
-
 Philippines
-
 Poland
-
 Portugal
-
 Puerto Rico
-
 Qatar
Qatar
-
 Reunion
-
 Romania
-
 Rwanda
-
 Saudi Arabia
-
 Serbia
-
 Singapore
-
 Slovakia
-
 Slovenia
-
 Somalia
-
 South Africa
-
 Spain
Spain
-
 Sri Lanka
-
 Sweden
-
 Switzerland
-
 Syria
Syria
-
 Taiwan
-
 Tajikistan
-
 Tanzania
-
 Thailand
-
 Trinidad and Tobago
-
 Tunisia
-
 Turkey
-
 UAE
UAE
-
 Uganda
-
 Ukraine
-
 United Kingdom
-
United States
-
 Uruguay
-
 Uzbekistan
-
 Venezuela
-
 Vietnam
-
 Yemen
Yemen
-
 Zambia
-
 Zimbabwe
- Forex
- Crypto












