

Berkshire Hathaway shares remain locked between $504.75 support and MA-20 resistance: weekly analysis

Shares of Berkshire Hathaway Inc. (BRK.B) are trading near $506 after gaining almost 2% this past week, as sellers remain active and the setup stays deep in oversold territory. The chart shows conflicting signals — while strength builds under the surface, near-term direction will depend on whether support or resistance is broken. The week ahead will hinge on which side seizes momentum from this tense standoff.
 573.14
595.83
Highlights
- Shares of Berkshire Hathaway rose $9.67 over the past 7 days to $505.8, now at the upper end of the weekly range.
- The stock maintains a strong long-term trend structure with price above key moving averages, despite a recent brief dip.
- Near-term trading is concentrated between support at $504.75 and resistance at $510.11, with a projected range of $501.75 to $520.67 for next week.
Sentiment lifts this week on strong earnings and aggressive capital moves
Berkshire reported a strong second quarter on rising revenue and net income, according to Simply Wall St, boosting sentiment as the company resumed share buybacks under new CEO Greg Abel, spending $4.5 billion in Q2, with repurchases ranging from $476 to $488 per share in May and June. The company’s cash holdings declined to $364.7 billion as of June 30, 2026, after deploying capital into a $6.8 billion Taylor Morrison acquisition and a $10 billion direct investment in Alphabet shares, as covered by Simply Wall St and Yahoo Finance. These actions highlight a more active capital deployment strategy, which will remain in focus for investors in the week ahead.
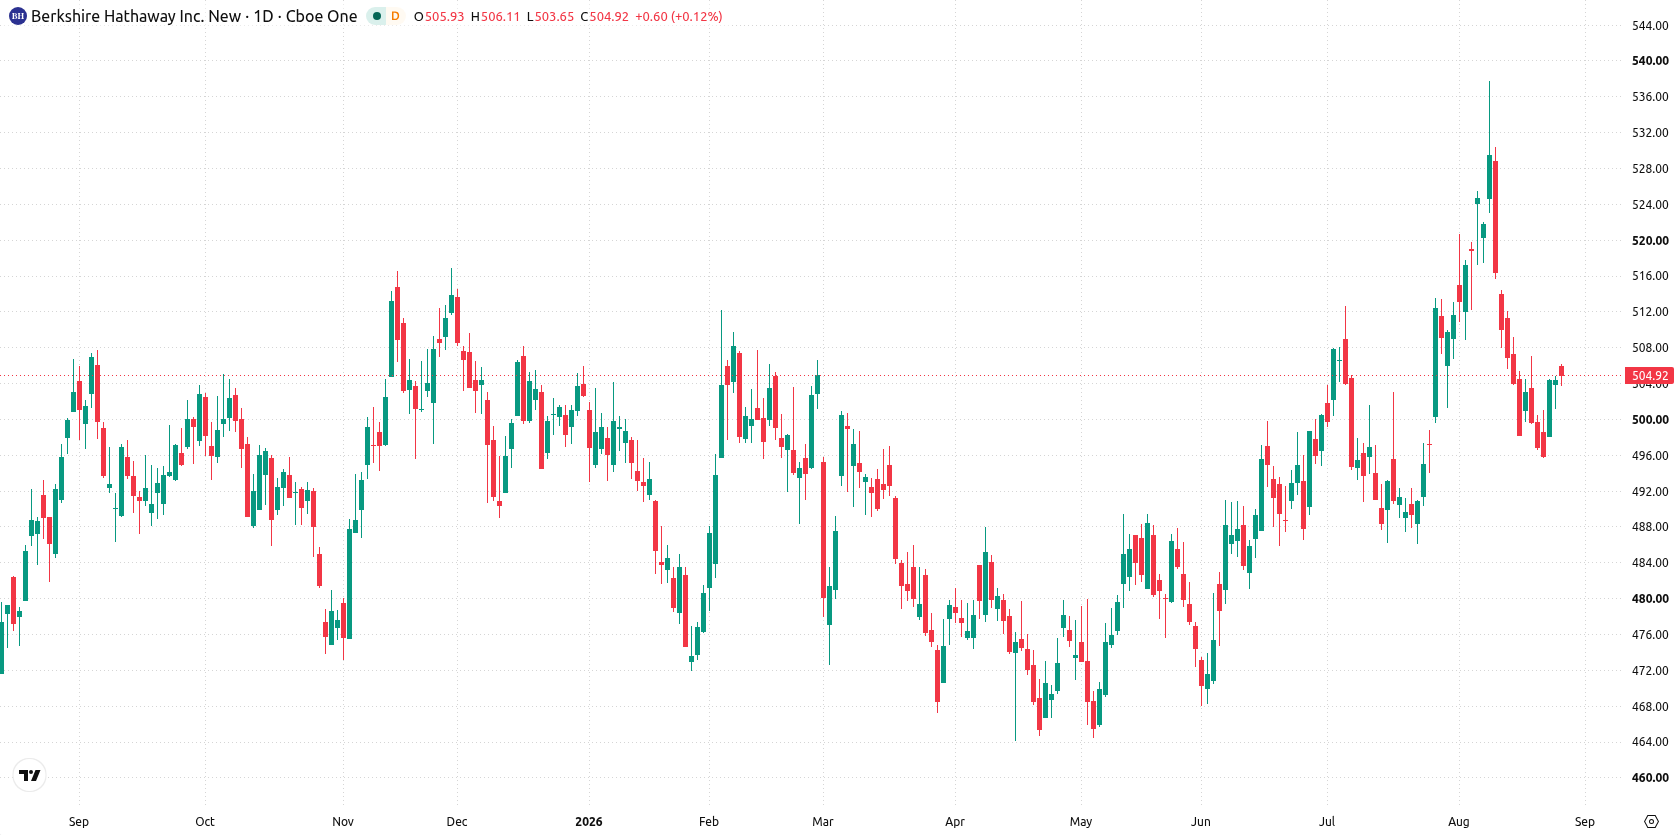
Momentum shifts upward as support and resistance tighten during week
On the daily chart, the setup is defined by a developing trend with volatility at 1.83%. Price is holding at immediate support at $504.75 and faces resistance at $510.11 from the MA-20, with the Ichimoku Kijun just above at $511.9 reinforcing a cap. While RSI sits neutral at 50.14, ADX reflects a strengthening backdrop with its "Buy" signal. Momentum character points to an emerging move higher that is not yet confirmed, making near-term direction highly sensitive to a break of these nearby levels.
Upside bias holds next week if resistance breaks amid elevated breakout risk
Next week, the expected range is $501.75 to $520.67. There is a very high probability of an increase and a very low probability of a decrease. The base case sees price consolidating between $504.75 support and $510.11 resistance. A decisive push above $510.11 and the Ichimoku Kijun at $511.9 would open the path toward the $520.67 zone. Conversely, a drop below $504.75 would weaken the setup and test support on the lower end of the forecast range.
Earlier, analysts noted that Berkshire Hathaway’s capital allocation strategy and long-term returns have been under scrutiny, with particular focus on the effectiveness of recent large investments. The current setup adds a new dimension, as technical signals point to $504.75 as the key support level that will determine whether the stock’s developing trend can gain momentum in the coming sessions.






Latest Berkshire Hathaway News





-
 Afghanistan
-
 Albania
-
 Algeria
-
 Angola
-
 Argentina
-
 Armenia
-
 Australia
-
 Austria
-
 Azerbaijan
-
 Bahamas
-
 Bahrain
-
 Bangladesh
-
 Belarus
-
 Belgium
-
 Bolivia
-
 Botswana
-
 Brazil
-
 Brunei
-
 Bulgaria
-
 Cambodia
-
 Cameroon
-
 Canada
-
 Chile
-
 China
-
 Colombia
-
 Congo
-
 Costa Rica
-
 Cote d'Ivoire
-
 Croatia
-
 Cuba
-
 Cyprus
-
 Czechia
-
 DR Congo
-
 Denmark
-
 Dominican Republic
-
 Ecuador
-
 Egypt
-
 El Salvador
-
 Estonia
-
 Eswatini
-
 Ethiopia
-
 Finland
-
 France
-
 Georgia
-
 Germany
-
 Ghana
-
 Greece
-
 Haiti
-
 Hong Kong
-
 Hungary
-
 India
-
 Indonesia
-
 Iran, Islamic republic
-
 Iraq
-
 Ireland
-
 Israel
-
 Italy
-
 Jamaica
-
 Japan
-
 Jordan
-
 Kazakhstan
-
 Kenya
-
 Korea
-
 Kuwait
-
 Kyrgyzstan
-
 Laos
-
 Latvia
-
 Lebanon
-
 Lesotho
-
 Libya
-
 Lithuania
-
 Luxembourg
-
 Madagascar
-
 Malaysia
-
 Malta
-
 Mauritius
-
 Mexico
-
 Moldova
-
 Mongolia
-
 Montenegro
-
 Morocco
-
 Mozambique
-
 Myanmar
-
 Namibia
-
 Nepal
-
 Netherlands
-
 New Zealand
-
 Nigeria
-
 North Macedonia
-
 Norway
-
 Oman
-
 Pakistan
-
 Palestine
-
 Panama
-
 Papua New Guinea
-
 Paraguay
-
 Peru
-
 Philippines
-
 Poland
-
 Portugal
-
 Puerto Rico
-
 Qatar
-
 Reunion
-
 Romania
-
 Rwanda
-
 Saudi Arabia
-
 Serbia
-
 Singapore
-
 Slovakia
-
 Slovenia
-
 Somalia
-
 South Africa
-
 Spain
-
 Sri Lanka
-
 Sweden
-
 Switzerland
-
 Syria
-
 Taiwan
-
 Tajikistan
-
 Tanzania
-
 Thailand
-
 Trinidad and Tobago
-
 Tunisia
-
 Turkey
-
 UAE
-
 Uganda
-
 Ukraine
-
 United Kingdom
-
United States
-
 Uruguay
-
 Uzbekistan
-
 Venezuela
-
 Vietnam
-
 Yemen
-
 Zambia
-
 Zimbabwe
- Forex
- Crypto












