

Procter & Gamble stock remains defensive as consolidation holds below resistance at $145.3: weekly analysis

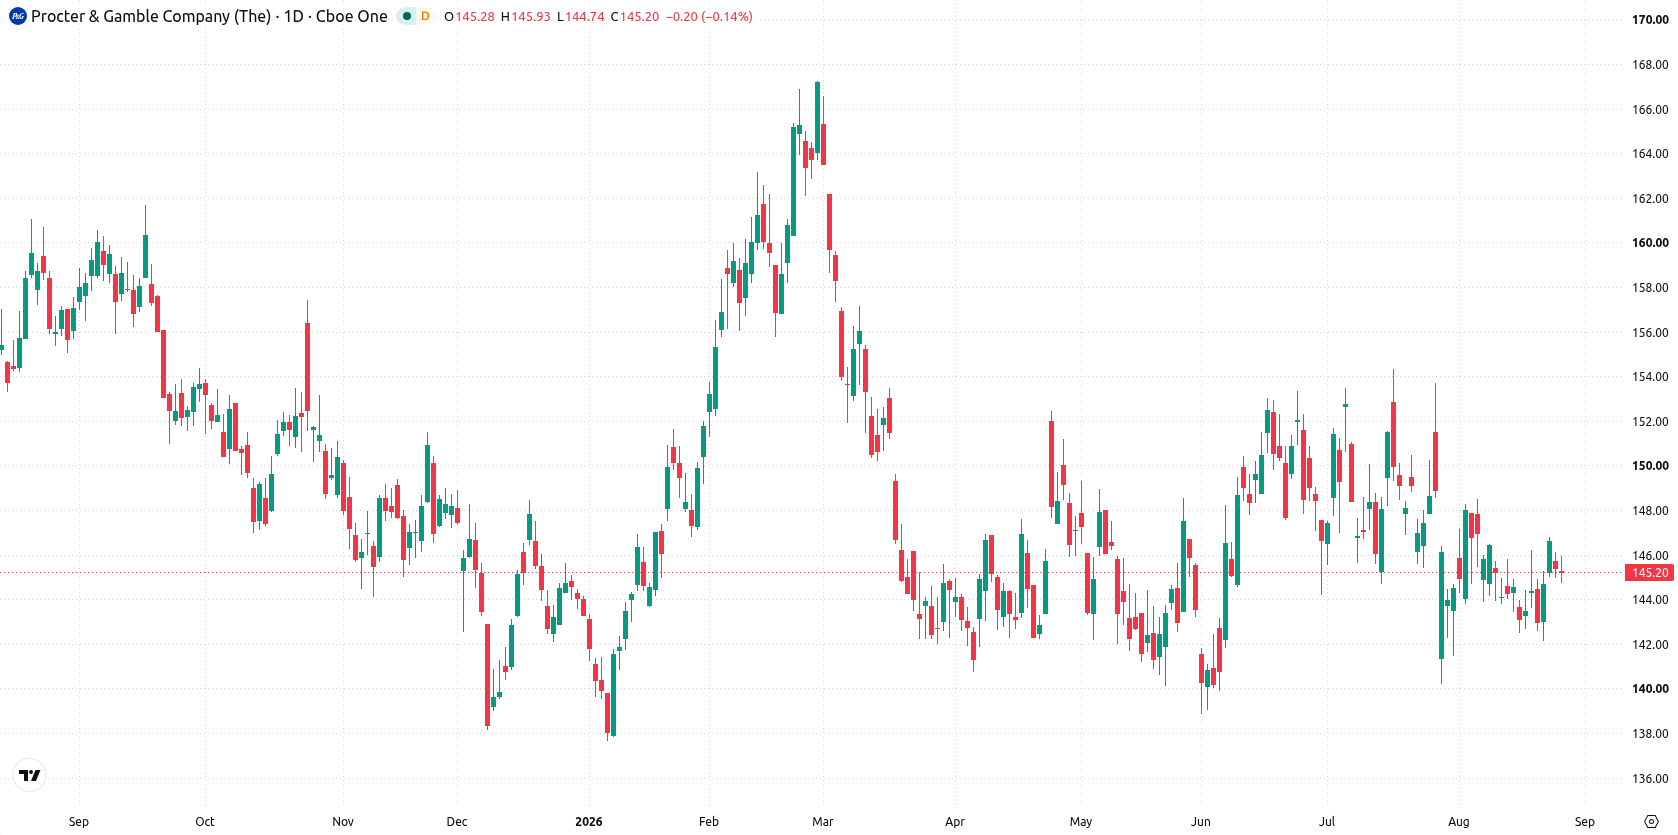
Shares of The Procter & Gamble Company (PG) are trading near $145, as a defensive setup remains in place following a quiet week for price action. Recent chart signals are mixed, with momentum indicators showing conflict and volatility still contained. A cautious tone persists as the stock navigates ongoing consolidation into the new week.
 163.57
Highlights
- Shares of Procter & Gamble moved up $0.37 over the last week to $145.19, consolidating at the 20-day moving average.
- Technical structure stays flat with shares trading below key longer-term averages and volatility reaching 2.97%.
- Price is expected to consolidate between support at $142.56 and resistance at $145.3, with an anticipated range of $139.84 to $148.66.
Acquisition and dividend hike drive institutional flows this week
Procter & Gamble has agreed to acquire Thorne for $3.8 billion, expanding its footprint in the nutritional supplements sector, according to Nutritional Outlook. The company extended its 70-year dividend hike streak with an increase in April 2026, as reported by Insider Monkey. Recent filings cited by DefenseWorld and American Market News highlight further accumulation from institutional holders, while management reaffirms its commitment to returning capital to shareholders in fiscal 2027.
Conflicting technical signals emerge amid flat weekly structure
On the daily chart, the overall structure is flat, with price movement characterized as a contained move within a narrow range and recent volatility at 2.97%. Stochastic RSI has reached an overbought reading of 100, while the MACD gives a strong sell forecast, highlighting a divergence with the HMA, which is pointing to buy. The nearest support is at $142.56 and resistance is pinned to the MA-20 at $145.3, with the Ichimoku Kijun at $146.94 acting as additional resistance.
Neutral bias and rangebound trade expected in the coming week
Over the coming trading week, the expected range is $139.84 to $148.66, with an even 50% probability for an increase or decrease. The base case is continued consolidation between support at $142.56 and resistance at $145.3. A sustained move above $145.3 could bring a challenge of the Ichimoku Kijun resistance at $146.94. If shares fall below $142.56 support, further downside towards the lower end of the expected range becomes likely.
Earlier, analysts noted that Procter & Gamble's focused portfolio and execution have supported a valuation premium compared to more diversified consumer peers. The current indecisive price structure, alongside mixed technical signals and recent strategic expansion into nutritional supplements, highlights $145.3 as a critical resistance level for traders monitoring potential breakout or continued consolidation scenarios.






Latest Procter & Gamble News




-
 Afghanistan
-
 Albania
-
 Algeria
-
 Angola
-
 Argentina
-
 Armenia
-
 Australia
-
 Austria
-
 Azerbaijan
-
 Bahamas
-
 Bahrain
-
 Bangladesh
-
 Belarus
-
 Belgium
-
 Bolivia
-
 Botswana
-
 Brazil
-
 Brunei
-
 Bulgaria
-
 Cambodia
-
 Cameroon
-
 Canada
-
 Chile
-
 China
-
 Colombia
-
 Congo
-
 Costa Rica
-
 Cote d'Ivoire
-
 Croatia
-
 Cuba
-
 Cyprus
-
 Czechia
-
 DR Congo
-
 Denmark
-
 Dominican Republic
-
 Ecuador
-
 Egypt
-
 El Salvador
-
 Estonia
-
 Eswatini
-
 Ethiopia
-
 Finland
-
 France
-
 Georgia
-
 Germany
-
 Ghana
-
 Greece
-
 Haiti
-
 Hong Kong
-
 Hungary
-
 India
-
 Indonesia
-
 Iran, Islamic republic
-
 Iraq
-
 Ireland
-
 Israel
-
 Italy
-
 Jamaica
-
 Japan
-
 Jordan
-
 Kazakhstan
-
 Kenya
-
 Korea
-
 Kuwait
-
 Kyrgyzstan
-
 Laos
-
 Latvia
-
 Lebanon
-
 Lesotho
-
 Libya
-
 Lithuania
-
 Luxembourg
-
 Madagascar
-
 Malaysia
-
 Malta
-
 Mauritius
-
 Mexico
-
 Moldova
-
 Mongolia
-
 Montenegro
-
 Morocco
-
 Mozambique
-
 Myanmar
-
 Namibia
-
 Nepal
-
 Netherlands
-
 New Zealand
-
 Nigeria
-
 North Macedonia
-
 Norway
-
 Oman
-
 Pakistan
-
 Palestine
-
 Panama
-
 Papua New Guinea
-
 Paraguay
-
 Peru
-
 Philippines
-
 Poland
-
 Portugal
-
 Puerto Rico
-
 Qatar
-
 Reunion
-
 Romania
-
 Rwanda
-
 Saudi Arabia
-
 Serbia
-
 Singapore
-
 Slovakia
-
 Slovenia
-
 Somalia
-
 South Africa
-
 Spain
-
 Sri Lanka
-
 Sweden
-
 Switzerland
-
 Syria
-
 Taiwan
-
 Tajikistan
-
 Tanzania
-
 Thailand
-
 Trinidad and Tobago
-
 Tunisia
-
 Turkey
-
 UAE
-
 Uganda
-
 Ukraine
-
 United Kingdom
-
United States
-
 Uruguay
-
 Uzbekistan
-
 Venezuela
-
 Vietnam
-
 Yemen
-
 Zambia
-
 Zimbabwe
- Forex
- Crypto












