

Hain Celestial stock falls over 4% as strong intraday selling and technical momentum weigh

Technical momentum dominated trading in The Hain Celestial Group (HAIN) as the stock fell 4.00% today on strong intraday selling pressure and a downside gap. The persistence of bearish long-term trends, with price still below the 200-day moving average and several momentum indicators flashing overbought signals, limits near-term rebound potential.
 0.1357
0.1618
Highlights
- Hain Celestial stock trades above short- and medium-term averages with bullish signals, but the long-term trend remains bearish below $0.84.
- Momentum and trend indicators show buyers currently dominate, yet overbought readings and high intraday volatility suggest near-term overheating.
- In the next five days, the expected price range is $0.68 to $1, with a breakout above $0.84 targeting the upper end.
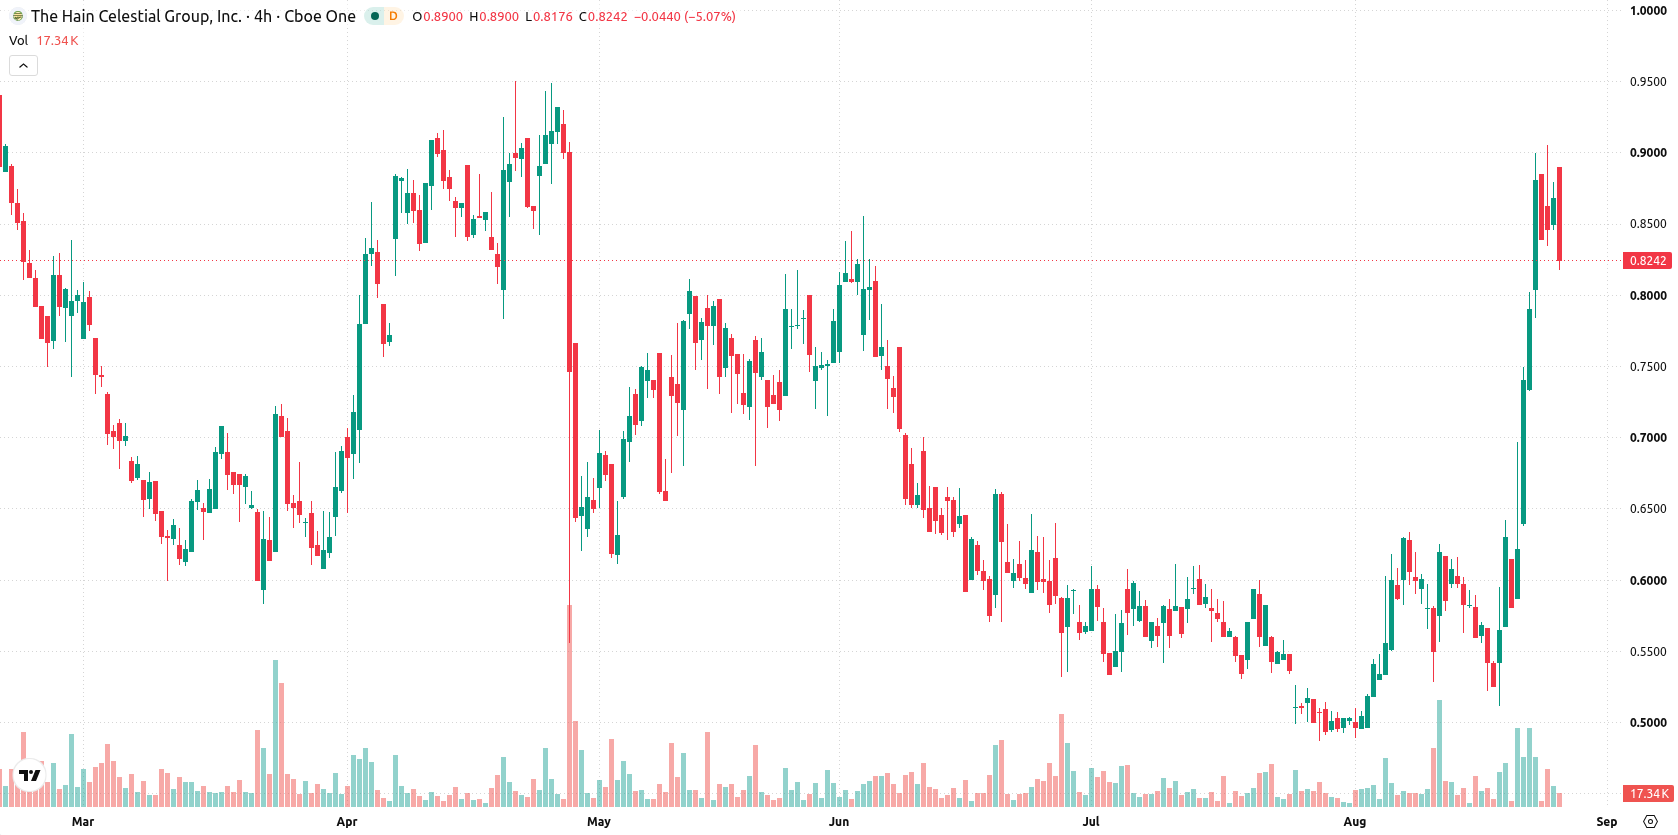
Bullish signals intensify despite overbought risk and long-term weakness
Hain Celestial is currently trading above both the 20-day and 50-day moving averages ($0.60 and $0.58), signaling a bullish tone for the short and medium term. The price remains just below the 200-day moving average at $0.84, keeping the long-term trend bearish, with near-term support at $0.83 and resistance at $0.84. Momentum indicators reflect strong buyer dominance: the Relative Strength Index (RSI) is high at 75.86 (“Buy”), the MACD is at 0.08 (“Buy”), and the Average Directional Index (ADX) stands at 20.68 (“Buy”). However, both the Stochastic RSI (100) and Commodity Channel Index (262.72) indicate overbought conditions. Bull/Bear Power (BBP) at 0.23 also confirms buyers dominate intraday action, and the Awesome Oscillator supports this bullish bias. The stock is down $0.035, or 4%, today after a downside gap of 2.29% and is trading near the session’s low, with elevated intraday volatility at 8.77%. Early session weakness and drop below previous levels highlight the need for caution, as some indicators signal overheating.
Earlier, analysts noted that Hain Celestial was exhibiting short-term bullish momentum despite a still-bearish long-term structure. The current technical setup introduces heightened volatility and overbought signals, making the $0.83–$0.84 zone a crucial pivot for breakout or breakdown scenarios in the near term.






Latest The Hain Celestial Group News




-
 Afghanistan
-
 Albania
-
 Algeria
-
 Angola
-
 Argentina
-
 Armenia
-
 Australia
-
 Austria
-
 Azerbaijan
-
 Bahamas
-
 Bahrain
-
 Bangladesh
-
 Belarus
-
 Belgium
-
 Bolivia
-
 Botswana
-
 Brazil
-
 Brunei
-
 Bulgaria
-
 Cambodia
-
 Cameroon
-
 Canada
-
 Chile
-
 China
-
 Colombia
-
 Congo
-
 Costa Rica
-
 Cote d'Ivoire
-
 Croatia
-
 Cuba
-
 Cyprus
-
 Czechia
-
 DR Congo
-
 Denmark
-
 Dominican Republic
-
 Ecuador
-
 Egypt
-
 El Salvador
-
 Estonia
-
 Eswatini
-
 Ethiopia
-
 Finland
-
 France
-
 Georgia
-
 Germany
-
 Ghana
-
 Greece
-
 Haiti
-
 Hong Kong
-
 Hungary
-
 India
-
 Indonesia
-
 Iran, Islamic republic
-
 Iraq
-
 Ireland
-
 Israel
-
 Italy
-
 Jamaica
-
 Japan
-
 Jordan
-
 Kazakhstan
-
 Kenya
-
 Korea
-
 Kuwait
-
 Kyrgyzstan
-
 Laos
-
 Latvia
-
 Lebanon
-
 Lesotho
-
 Libya
-
 Lithuania
-
 Luxembourg
-
 Madagascar
-
 Malaysia
-
 Malta
-
 Mauritius
-
 Mexico
-
 Moldova
-
 Mongolia
-
 Montenegro
-
 Morocco
-
 Mozambique
-
 Myanmar
-
 Namibia
-
 Nepal
-
 Netherlands
-
 New Zealand
-
 Nigeria
-
 North Macedonia
-
 Norway
-
 Oman
-
 Pakistan
-
 Palestine
-
 Panama
-
 Papua New Guinea
-
 Paraguay
-
 Peru
-
 Philippines
-
 Poland
-
 Portugal
-
 Puerto Rico
-
 Qatar
-
 Reunion
-
 Romania
-
 Rwanda
-
 Saudi Arabia
-
 Serbia
-
 Singapore
-
 Slovakia
-
 Slovenia
-
 Somalia
-
 South Africa
-
 Spain
-
 Sri Lanka
-
 Sweden
-
 Switzerland
-
 Syria
-
 Taiwan
-
 Tajikistan
-
 Tanzania
-
 Thailand
-
 Trinidad and Tobago
-
 Tunisia
-
 Turkey
-
 UAE
-
 Uganda
-
 Ukraine
-
 United Kingdom
-
United States
-
 Uruguay
-
 Uzbekistan
-
 Venezuela
-
 Vietnam
-
 Yemen
-
 Zambia
-
 Zimbabwe
- Forex
- Crypto












