

Dividend cut and index removal weigh on Telus stock near C$13.24 support

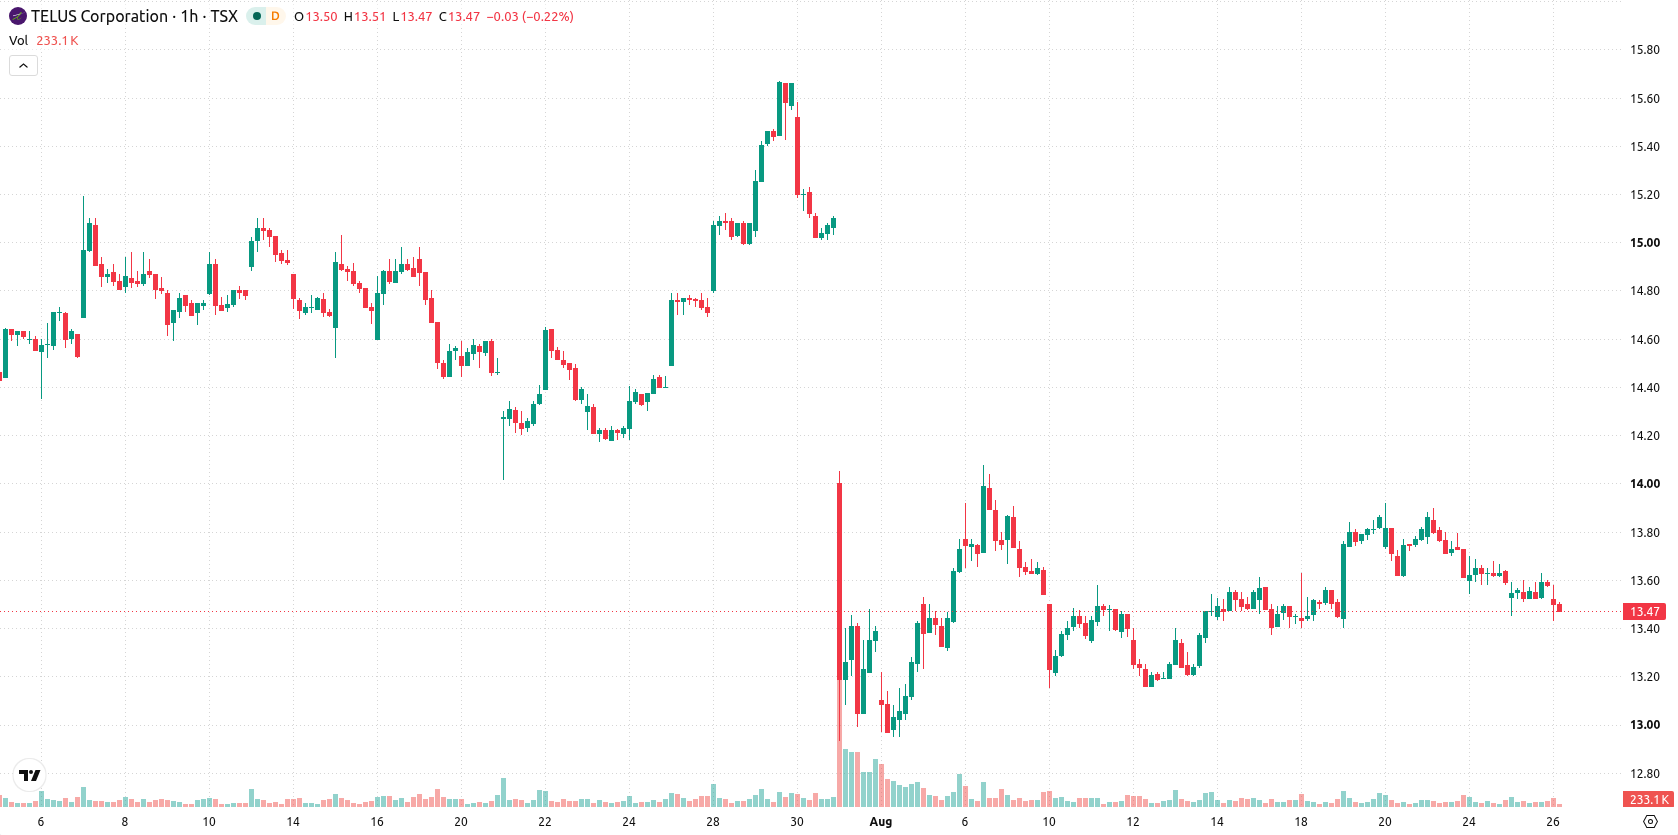
Telus (T) stock is trading at C$13.45 after closing with a modest decline and finishing near the session low. The price is positioned below its key moving averages, suggesting pressure from sellers across different investment timeframes.
 13.80
13.80
Highlights
- Telus stock lost its S&P/TSX Canadian Dividend Aristocrats Index status after announcing a 55% dividend cut effective October 2026.
- The companys dividend reduction and index removal raise questions about cash flow management and future capital allocation.
- Telus trades below key moving averages with technical signals pointing to a high probability of continued declines within a C$13.24 to C$13.66 range.
Dividend cut and index removal drive waning income investor appeal
Telus has been removed from the S&P/TSX Canadian Dividend Aristocrats Index following its decision to reduce its quarterly dividend by approximately 55%, from 41.84 cents to 18.75 cents per share, effective October 2026, according to Thedeepdive. This loss of 'dividend aristocrat' status signals a substantial drop in the company's projected yield, likely dampening interest from income-oriented investors as well as index-tracking funds. Index exclusion and the scale of the dividend reduction have heightened attention on corporate cash flow priorities and future capital allocation, contributing to a cautious investor response.
Technical sell signals deepen as trend diverges from intraday buying
On the hourly chart, T is trading below the MA-20 and MA-50 (C$13.63) as well as under the long-term MA-200 (C$17.21). Immediate resistance is defined by the Ichimoku Kijun at C$13.68, while the technical support level sits near C$13.24. MACD shows a Sell signal, ADX is Neutral, and RSI prints at 45.59 (Sell) alongside CCI on Sell. Stoch RSI is Overbought, reflecting diverging short-term oscillator signals. Bull/Bear Power currently indicates buyer dominance intraday, but this does not match the wider setup, and the Awesome Oscillator is Neutral.
Sideways range persists as upside limited and downside risk dominates
In the near term, T is likely to consolidate within the C$13.24 to C$13.66 range, with any sustained upward move improbable—upside probability remains below 20%, while the risk of further declines is over 80%. The baseline scenario is continued sideways action within this price corridor, barring a significant break. A bullish reversal would require a break above C$13.68, while renewed downward momentum could accelerate if price slips under the C$13.24 support.
Earlier, analysts noted that Telus faced mounting downside risks and a bearish technical outlook following its removal from the S&P/TSX Canadian Dividend Aristocrats Index and a sharp dividend reduction. The latest technical setup reinforces the likelihood of continued rangebound trading, with C$13.24 remaining an essential support level to monitor for signs of renewed selling pressure.










-
 Afghanistan
-
 Albania
-
 Algeria
-
 Angola
-
 Argentina
-
 Armenia
-
 Australia
-
 Austria
-
 Azerbaijan
-
 Bahamas
-
 Bahrain
-
 Bangladesh
-
 Belarus
-
 Belgium
-
 Bolivia
-
 Botswana
-
 Brazil
-
 Brunei
-
 Bulgaria
-
 Cambodia
-
 Cameroon
-
 Canada
-
 Chile
-
 China
-
 Colombia
-
 Congo
-
 Costa Rica
-
 Cote d'Ivoire
-
 Croatia
-
 Cuba
-
 Cyprus
-
 Czechia
-
 DR Congo
-
 Denmark
-
 Dominican Republic
-
 Ecuador
-
 Egypt
-
 El Salvador
-
 Estonia
-
 Eswatini
-
 Ethiopia
-
 Finland
-
 France
-
 Georgia
-
 Germany
-
 Ghana
-
 Greece
-
 Haiti
-
 Hong Kong
-
 Hungary
-
 India
-
 Indonesia
-
 Iran, Islamic republic
-
 Iraq
-
 Ireland
-
 Israel
-
 Italy
-
 Jamaica
-
 Japan
-
 Jordan
-
 Kazakhstan
-
 Kenya
-
 Korea
-
 Kuwait
-
 Kyrgyzstan
-
 Laos
-
 Latvia
-
 Lebanon
-
 Lesotho
-
 Libya
-
 Lithuania
-
 Luxembourg
-
 Madagascar
-
 Malaysia
-
 Malta
-
 Mauritius
-
 Mexico
-
 Moldova
-
 Mongolia
-
 Montenegro
-
 Morocco
-
 Mozambique
-
 Myanmar
-
 Namibia
-
 Nepal
-
 Netherlands
-
 New Zealand
-
 Nigeria
-
 North Macedonia
-
 Norway
-
 Oman
-
 Pakistan
-
 Palestine
-
 Panama
-
 Papua New Guinea
-
 Paraguay
-
 Peru
-
 Philippines
-
 Poland
-
 Portugal
-
 Puerto Rico
-
 Qatar
-
 Reunion
-
 Romania
-
 Rwanda
-
 Saudi Arabia
-
 Serbia
-
 Singapore
-
 Slovakia
-
 Slovenia
-
 Somalia
-
 South Africa
-
 Spain
-
 Sri Lanka
-
 Sweden
-
 Switzerland
-
 Syria
-
 Taiwan
-
 Tajikistan
-
 Tanzania
-
 Thailand
-
 Trinidad and Tobago
-
 Tunisia
-
 Turkey
-
 UAE
-
 Uganda
-
 Ukraine
-
 United Kingdom
-
United States
-
 Uruguay
-
 Uzbekistan
-
 Venezuela
-
 Vietnam
-
 Yemen
-
 Zambia
-
 Zimbabwe
- Forex
- Crypto












